Graph theoretic measures applied to EEG have shed insight into differences in brain networks associated with neuropsychiatric disorders such as Alzheimer’s and Schizophrenia. Here are some of them.
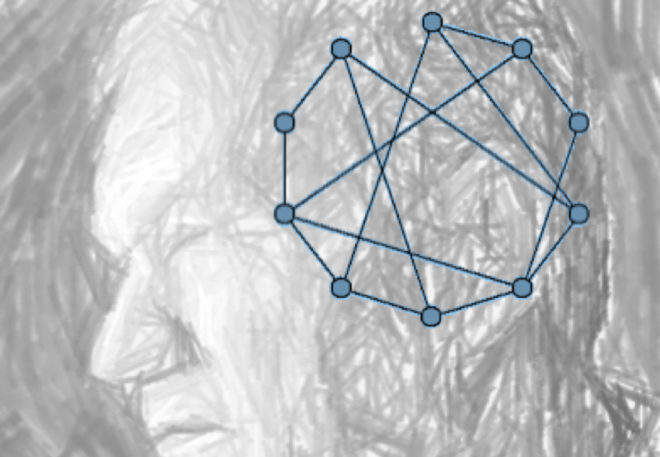
In the previous blog post, we discussed some fundamentals of graph theory and how graph theoretic measures can be used to gain insights into the properties of networks. To recap with a simple example, with EEG recordings we could construct a network where the nodes are the EEG sensors and the links between the nodes can represent connections between them, as obtained using functional connectivity. In this blogpost, we will focus on how graph theoretic measures computed using such functional networks, have been used to shed light on some neuropsychiatric disorders.
Small-world networks and neuropsychiatric disorders
Recall that a network is said to exhibit small-world property when it is characterized by a high degree of local interaction (presence of cliques) and few short cuts between the nodes. Mathematically, this is represented by what is known as a small-world coefficient, which is simply the ratio of the (normalized) clustering coefficient of a network to the (normalized) average path length. Normalization here simply means that these measures are divided by the corresponding measures obtained from a random network of the same size – so in other words, it uses the degree of difference of these measures relative to a random network. The small world networks were first described by Watts and Strogatz, which were obtained by randomly rewiring a regular network (see previous blog post) and such networks have a small-world coefficient greater than 1.
Several studies have shown that small-world configuration is essential for healthy brain function and a deviation from this may result in disorders. For instance , using EEG (see Figure below) it was shown that in Alzheimer’s disease (AD), the clustering coefficient decreased in the lower alpha and beta bands, while the mean path length reduced in the lower alpha and gamma band, compared to controls [1]. However in case of frontotemporal lobe degeneration (FTLD), no significant difference with the controls was found. In this work, the authors used synchronization likelihood as a measure of functional connectivity between pairs of EEG electrodes. Overall, the authors reported that their results supported the disconnection hypothesis in AD, by demonstrating that deviation from SW networks towards a more random network results in less efficient information exchange between the brain areas.
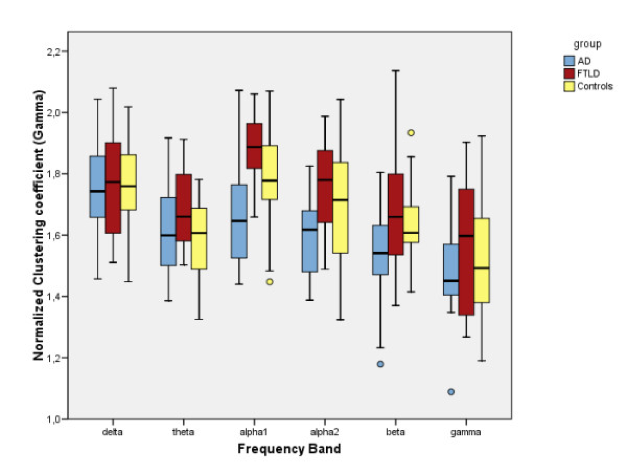
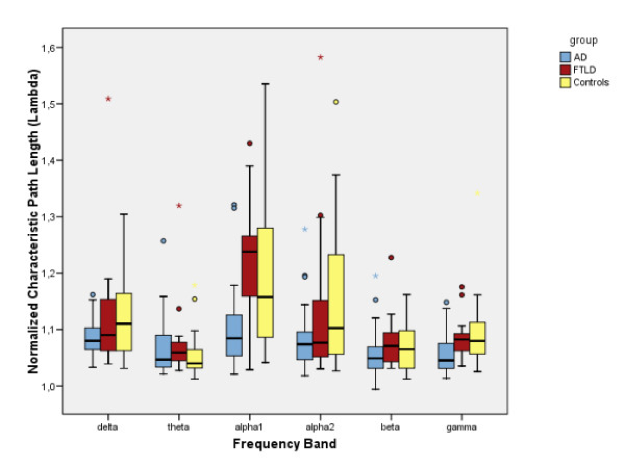 Figure from [1]
In another study, again using EEG it was shown that , during a working memory task the control group exhibited small-world property, which was not seen in the schizophrenia group [2]. Similarly, deviation from small world networks have been implicated in Autism as well [3].
Topology of small-world networks
Although, the small-world network as proposed by Watts and Strogatz are optimal for information transfer (where you can reach the other end of the network through shortcuts), its topology does not resemble the organization of the brain (see Figure below)
Many studies have shown that a variety of topological arrangements can still give rise to the small-world property . Figure 2 (b) has typical characteristics of a small-world network and so does Figure 1 (a). The hierarchical cluster shown in Figure 2(b) resembles the hierarchical and modular architecture observed from cellular microstructures in cortical columns all the way up to clusters of highly connected brain regions [5].
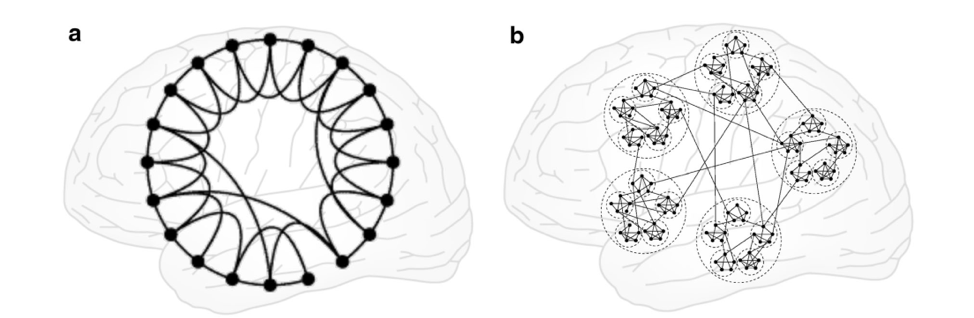
Figure from [4]
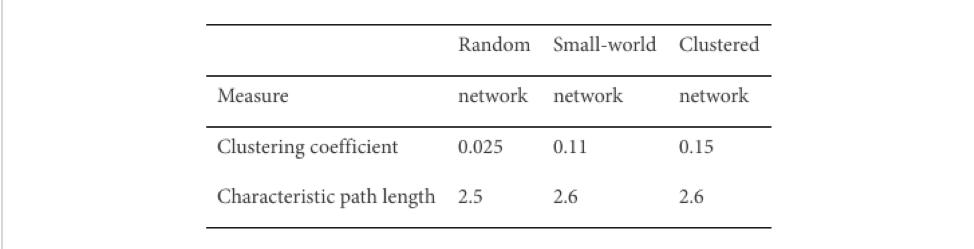
The table below [4] shows the clustering coefficient and average path length measured from random, small-world and clustered network.
 Caveats
There are multiple caveats in applying graph theoretical measures and interpreting them. For example, defining nodes for functional networks is not simple. Although many studies have used EEG sensors as nodes, volume conduction may lead to overestimation of network measures [6].
The effect of volume conduction can be limited to some extent by using measures such as imaginary part of coherence or phase lag index, but these are bivariate measures and are affected by indirect connections, which can result in incorrect links between two nodes that are only connected through an intermediate node. This will consequently affect the network measure estimates as it results in an incorrect topology.
Functional connectivity networks can also be estimated after solving the EEG inverse problem to limit the effects of volume conduction and measures such as partial directed coherence can be used to resolve the issue of spurious estimation of indirect connections, it has to be kept in mind that the solution to the EEG inverse problem itself is sensitive to many parameters, including the choice of head model, conductivity values and filtering. Although MEG is less sensitive to the first two issues, the issue of defining nodes in the source-space remains, which is currently defined in an arbitrary way. For example, the source-space is divided into anatomical parcels, and the centroid of each parcel is considered as a node and links are defined between these nodes after connectivity estimation. Depending on how nodes are defined , the estimated network measure may give a different value!
Also, many studies use unweighted, binary graphs which are obtained after thresholding. Again, how to choose this threshold? A different threshold will lead to a different network topology and consequently to a different network measure! Another major caveat concerns the assessment of statistically significant links. Which method to use to generate surrogate data? Several studies have reported results without multiple testing, which can also affect the result.
Network analysis is a valuable tool, but it depends on a lot of parameters. Right from recording the EEG data to estimating functional connectivity to constructing networks and discarding statistically irrelevant links, distortions can take place at every step due to choice of parameters, which ultimately affect the network measure!
References
- de Haan, W., Pijnenburg, Y.A., Strijers, R.L., van der Made, Y., van der Flier, W.M., Scheltens, P. and Stam, C.J., 2009. Functional neural network analysis in frontotemporal dementia and Alzheimer’s disease using EEG and graph theory. BMC neuroscience, 10(1), p.101.
- Micheloyannis, S., Pachou, E., Stam, C.J., Breakspear, M., Bitsios, P., Vourkas, M., Erimaki, S. and Zervakis, M., 2006. Small-world networks and disturbed functional connectivity in schizophrenia. Schizophrenia research, 87(1-3), pp.60-66.
- Barttfeld, P., Wicker, B., Cukier, S., Navarta, S., Lew, S. and Sigman, M., 2011. A big-world network in ASD: dynamical connectivity analysis reflects a deficit in long-range connections and an excess of short-range connections. Neuropsychologia, 49(2), pp.254-263.
- Hilgetag, C.C. and Goulas, A., 2016. Is the brain really a small-world network?. Brain Structure and Function, 221(4), pp.2361-2366.
- Kaiser, M., Goerner, M. and Hilgetag, C.C., 2007. Criticality of spreading dynamics in hierarchical cluster networks without inhibition. New Journal of Physics, 9(5), p.110.