
Sleep and exercise impact overall mental wellbeing. Here we show that the impact is across all mental health elements and not specific to any one.
In a previous post we spoke about the relationship between sleep, exercise and mental wellbeing (see Sleep, Exercise and Mental Health). The striking relationship that we saw within the data, collected as part of the Mental Health Million Project, documented how frequent exercising and getting enough sleep were both associated with considerably higher mental wellbeing. In this post we explore this relationship further, comparing the mental wellbeing profiles across groups of respondents with different exercise habits and sleep outcomes.
Deconstructing mental wellbeing with the MHQ
The MHQ, the assessment tool that we use to measure mental wellbeing, not only provides an overall measure of mental wellbeing but is also designed to evaluate individual symptoms. The 47 items in the MHQ, compiled from an extensive review of ~10,000 questions spanning 126 existing mental health questionnaires and interviews, provide a comprehensive overview of mental health symptoms spanning 10 major disorders, as well as strengths and assets not usually covered by traditional mental health screeners or diagnostics. This allows us to not just see how exercise and sleep are affecting one aspect of mood or cognition, but to look across a broad range of mental health indicators in a single assessment framework.
Within the MHQ, these 47 items are split into the two question types – problem and spectrum items. These reflect the unique design of the MHQ where answers do not require respondents to remember the frequency or duration of a particular symptom, but instead are based on the impact that the symptom or attribute has on the person’s ability to function effectively in life. For problem items, the scale ranges from no problem at all through to having a severe impact on a person’s ability to function. In contrast, the spectrum item scale ranges from having a severe impact on a person’s ability to function in life, through to being an asset to their life and performance, therefore spanning negative through positive and incorporating the presence of strengths and assets that are important for assessments of overall wellbeing.
MHQ profiling according to exercise habits and sleep outcomes
So when you deconstruct the overall MHQ score into its component 47 symptoms and attributes, how do the profiles of those who exercise frequently compare with those who rarely exercise? And how do the profiles of those who regularly get enough sleep compare with those who rarely do so?
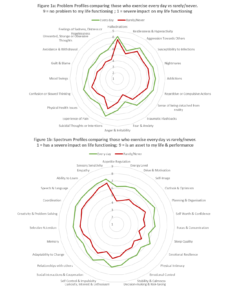
Below we can see the profiles comparing those who report that they exercise every day compared to those who report they rarely exercise, for both problem (fig 1a) and spectrum (fig 1b) items.
What you see is that those respondents who rarely or never exercise report challenges across the board. All 27 spectrum items and 20 items have, on average, lower rating responses for respondents who rarely/never exercise compared to those who exercise every day.
Within this overall pattern, however, the difference between these two groups is larger for some items compared to others. For example within the problem items, it is ratings for avoidance & withdrawal; unwanted, strange or obsessive thoughts; and feelings of sadness, distress or hopelessness, which show the greatest difference, while for spectrum items it is rating responses for appetite regulation; energy levels; and drive & motivation which differ the most.
A similar pattern is seen when you compare those who get enough sleep all the time compare to those who hardly ever get enough sleep (figures 2a & 2b) with a general pattern of lower rating responses across all 47 items.
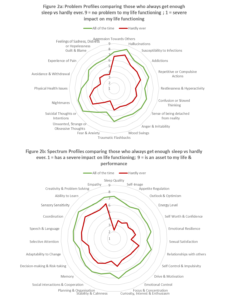
When you then start to dig into which items show the greatest difference between those respondents who are getting enough sleep compared to those who aren’t, then you see that for problem items, the biggest difference in rating responses are for experience of pain; guilt and blame; and feelings of sadness, distress or hopelessness. For spectrum items, the biggest differences in ratings (after sleep quality) are for self-image, appetite regulation and outlook and optimism.
The trend for reduced mental wellbeing across the board for poor sleep or sedentary lifestyles, also highlights the challenges with self-report data, and knowing how patterns are due to the variable of interest, and how much they are a result of halo effects. For example, the finding that the item of sadness, distress or hopelessness was one of the main differentiators between the groups, raises the possibility of knock-on effects – perceived or otherwise – on other reported symptoms. In future, studying these symptoms and attributes as dynamic and interactive networks will help to understand some of these effects.
Using the MHQ and the Mental Health Million Data in your Research.
These in-depth MHQ profiles are just one way to look at the data generated by the Mental Health Million Project. As more data is collected, we envisage that clinically useful phenotypes will emerge that will reflect not just symptoms and attributes, but life context factors such as exercise habits and sleep outcomes. In addition, as the items on the MHQ can also be mapped to established DSM criteria for 10 mental health disorders, it offers a bridge between traditional methods of diagnosis and newer transdiagnostic frameworks such as RDoC.
To find out more about how you can access the data being produced using the MHQ then please fill in our data access request form that can be found here. If you want to use the MHQ in your research then please see here.
How much is the overlap between exercise regularly and sleep enough? Often, exercise regularly goes hand in hand with sleep enough.