Spectral changes in the EEG are common across multiple mental health disorders calling for caution in interpreting studies of individual disorders in isolation.
According to the World Health Organization, 450 million people worldwide suffer from some form of mental disorder [1]. Each disorder typically represents a range of behavioral and affective symptoms and is usually diagnosed using clinical interviews structured around the diagnosis classification systems of DSM-5 and ICD-11. However, due to the subjective nature of these interviews (see The Challenges of Mental Health Diagnosis), there have been efforts to develop more objective symptom biomarkers, using techniques such as spectral changes in the resting-state EEG. (see EEG Based Biomarkers and the Many Pitfalls). An example is the theta/beta ratio which has been approved by the FDA as a diagnostic marker of ADHD.
One concern, however, is that the majority of clinical resting-state EEG studies focus primarily on one disorder at a time, and do not offer a perspective across a broader range of psychiatric disorders. Therefore, whilst a study may report changes in particular frequency bands for one disorder type, it is not always obvious whether this is specific to this particular disorder, or whether similar patterns of change are found across other disorders.
Cross-disorder approach
To explore this, we have reviewed the results from 184 resting-state EEG studies published over the last 25 years (n>20; comparison of clinical vs control group; performing a spectral band analysis) across 10 different psychiatric disorders (ADHD, depression, schizophrenia, bipolar disorder, autism, addiction, obsessive-compulsive disorder, anxiety and panic disorder) to investigate the patterns of spectral change reported, and reveal similarities and dissimilarities both between and within different brain disorders during the resting-state.
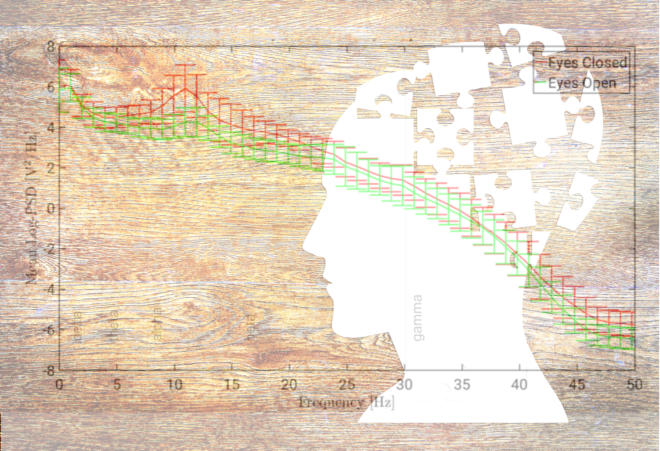
To do this we first compiled together the significant differences (increase or decrease) or lack of significant differences in power/amplitude across each spectral band (delta, theta, alpha, beta; gamma was excluded due to the low number of studies including this band in their analysis) for each of the 184 studies, taking into account whether the study was with eyes closed or eyes open, and whether it analyzed absolute or relative power. We then identified the most frequently occurring (i.e. dominant) result (significant increase, significant decrease, no significant difference) for each condition (eyes open/eyes closed; relative/absolute), band and disorder.
For example, for ADHD in children (eyes open; absolute power; delta band) there were 13 studies reporting a significant increase, 1 study reporting no difference and 3 studies reporting a significant decrease. In this case the dominant result is a significant increase. The dominant result was considered to be “no difference” when there was an equal number of studies showing no change as there were showing either an increase or decrease, and “opposing” was when there was an equal number of studies showing an increase and a decrease (and the number was higher than those showing no significant difference).
A view of these results is presented below.
Dominant patterns of spectral change.
When collapsing across all conditions, bands and disorders, we found that the most common result was no significant difference (~60%), which suggests that spectral changes are not a generally useful marker of mental health disorders. However, when focusing on those disorders and conditions where the dominant result was a significant increase or decrease, the general pattern that emerged was of increases dominating in the lower frequency delta and theta bands (~85%), while decreases dominated in the alpha band (~85%). In contrast, decreases were roughly as likely as increases in the beta band depending on the condition.

Illustration of the dominant pattern of results across bands and conditions.
At the level of the individual disorders, the results showed that there was an increase in absolute power for delta and/or theta across a number of disorders, including ADHD (in children), schizophrenia, OCD and depression, bipolar disorder, ADHD (in adults) and alcohol addiction. In fact, the only cases in the lower frequency bands where the dominant result was a decrease, rather than an increase, was for autism (eyes closed) and PTSD/early life stress (eyes open).

Illustration of the dominant pattern of results across disorders and conditions.
For the higher frequency alpha and beta bands, both increases and decreases (absolute power) were reported depending on the condition/disorder type. For example, significant decreases were dominant in the alpha and/or beta band for schizophrenia (eyes closed), OCD, autism, PTSD, ADHD (children), and internet addiction, whilst significant increases were dominant for depression, bipolar disorder, schizophrenia (eyes open) and alcohol addiction. Thus there was substantial variability in the results depending on whether it was an eyes closed or eyes open. In ADHD there were also significant differences between children and adults.

Comparison of reported results for absolute and relative power
When comparing the dominant results for absolute power versus the results reported for relative power we found that, for 62% of disorders/conditions, the result was the same, whilst, in general, there was a greater proportion of “no significant” differences for relative power. Further,
Summary
Overall, these results suggest that similar patterns of spectral change are observed across multiple disorders, rather than being unique to one disorder type. In particular, increases across lower frequency bands and/or decreases across higher frequency bands are found for a number of different disorders including ADHD (children), schizophrenia, OCD and internet addiction. This is particularly relevant in relation to discussions about the theta/beta ratio for diagnosing ADHD [2,3] (see ADHD and the Theta/Beta Ratio) and suggests that a similar pattern of either an increase in theta and/or a decrease in beta may be shared to some degree by these other disorders rather than being specific to ADHD. These results therefore caution any interpretation of spectral change from studies that consider only one disorder in isolation, and have implications for the development of disorder specific EEG biomarkers.
The full results of our review have recently appeared in Frontiers in Human Neuroscience.
[1] Sayers, J. (2001). The world health report 2001—Mental health: new understanding, new hope. Bull. World Health Organ. 79, 1085–1085.
[2] Saad, J. F., Kohn, M. R., Clarke, S., Lagopoulos, J., and Hermens, D. F. (2015). Is the theta/b EEG Marker for ADHD inherently flawed? J. Atten. Disord. 22, 815–826. doi: 10.1177/1087054715578270
[3] Gloss, D., Varma, J. K., Pringsheim, T., and Nuwer, M. R. (2016). Practice Q20 advisory: the utility of EEG theta/beta power ratio in ADHD diagnosis: report of the guideline development, dissemination, and implementation subcommittee of the american academy of neurology. Neurology 87, 2375–2379. doi: 10.1212/WNL.0000000000003265