Graph theory has been most commonly used to understand the structure of social networks and has gained traction in the last decade as an important tool in the understanding brain networks. What are the elements of graph theory and how does it apply to EEG?
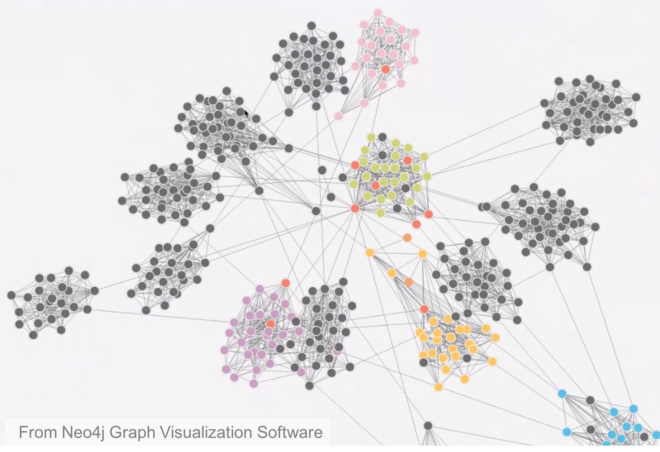
What is common between twitter, facebook , power grids, the world wide web and your brain ? They are all networks. Graph theory provides the mathematical framework to study networks and the information flow in them. And one of the fundamental questions in neuroscience is how different regions of the brain communicate with each other to perform cognitive tasks and how such communication is impaired in certain neurological disorders.
see related post EEG Connectivity Using Phase Lag Index
What is a ‘Graph’ in Graph Theory?
As shown below, a graph is simply represented by a set of nodes (red circles) and edges (black lines) connecting the nodes.
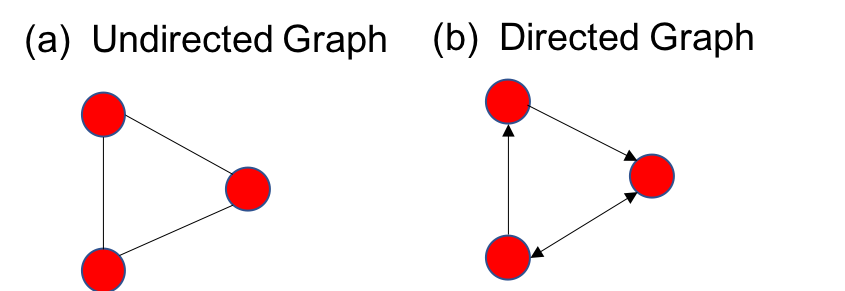
It is also possible to give direction to the edges, which means that the information flows in only one direction. Such a graph is known as a directed graph, as opposed to bidirectional information flow shown in the undirected graph in (a) above. In a social network like facebook, the nodes are nothing but the people and an edge can define, for example, friendship between the people. Thus it is an undirected network. In case of social networks like twitter or instagram, the link between people can be unidirectional. For example you may follow someone, but that person may not follow you back. Thus it is a directed graph (like (b) above.
Representing a Graph in Matrices
Graphs can also be classified into weighted and unweighted graphs. An unweighted graph contains edges of equal strength, like the graph obtained from facebook where two people are either friends or not and there is no measure of the strength of friendship between people. Now one can think of building a weighted graph by assigning different numbers to the edges, such as the number of years two people have been friends. In this case, each edge can have different values, whereas in the case of an unweighted graph the edge value is either 0 (i.e., no edge) or 1.
We can represent a graph as an adjacency matrix, where the off diagonal elements of the matrix contain information about whether an edge is present between each pair of nodes. The example shows adjacency matrices derived from an undirected and unweighted graph such that the presence of an edge between the nodes is simply represented as a 1 and the absence as 0. In a weighted graph, the strength of the link or edge could be a number, maybe a count (such as number of messages from one friend in a node to the other) or a fraction between 0 and 1 where 1 represents the maximum strength.
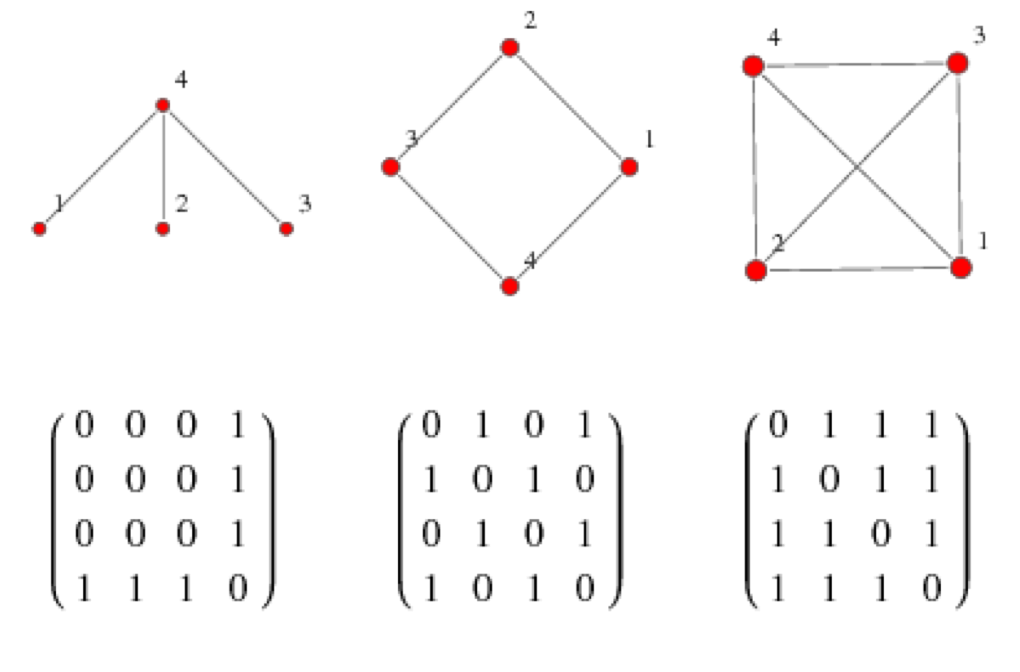 Figure from http://mathworld.wolfram.com/AdjacencyMatrix.html
Graph Theory and EEG
So coming back to the brain, how can we define nodes and links? And what kind of graphs to build? And what kind of information can we extract from adjacency matrices obtained?
Well, there are many approaches to address these questions. For instance, using EEG signals, we can understand functional connectivity networks or a picture of how different parts of the brain are communicating with one another using graph theory. In this case, we can define nodes as the location of the electrodes (or estimated sources we are interested in after solving the inverse problem) and the edges as some measure of functional connectivity between these electrodes (functional just means it is about something ongoing and changes as opposed to an physical anatomical link which would be structural connectivity and could be estimated with techniques such at diffusion tensor imaging). There are many measures of functional connectivity in EEG. Each looks at some aspect of the signal to develop an estimate functional connectivity. Some examples are coherence or phase locking value for undirected networks, or measures such as directed coherence to obtain directed graphs. A typical pipeline of obtaining functional networks from EEG is shown below.
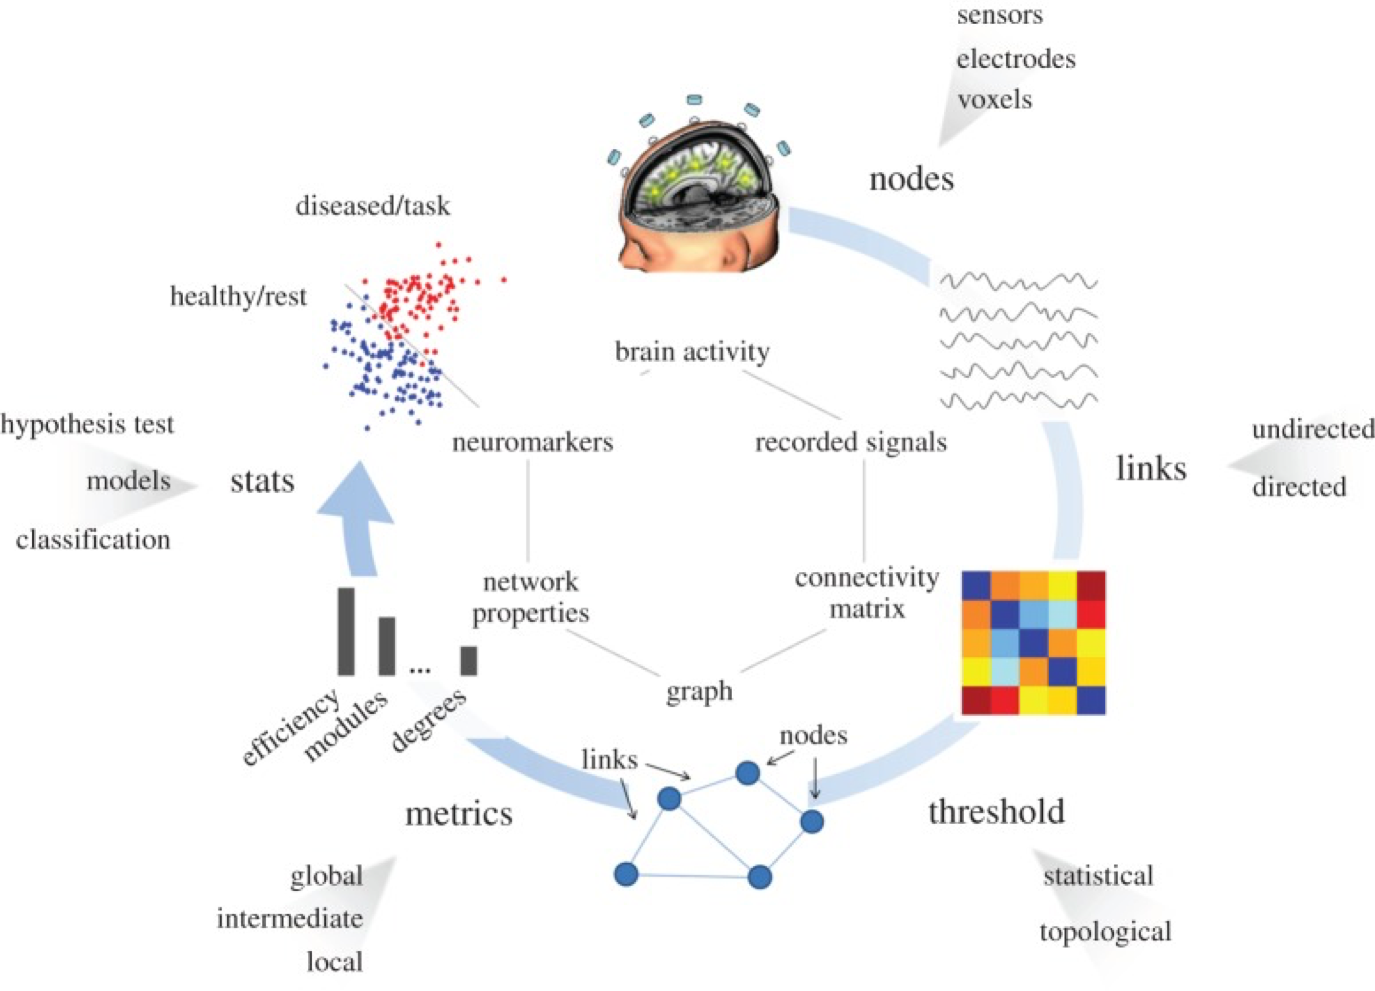 Figure from [1]
Extracting Network Measures from Adjacency Matrices
So what can be done after building graphs and extracting adjacency matrices from these functional networks ? One can compute an arsenal of network measures to characterize the networks and interpret them. Some of the most commonly known measures are degree, clustering coefficient and mean path length.
The Degree of a node in defined as the total (inward + outward for directed networks) number of connections it has to other nodes and the degree distribution is simply the probability distribution of these degrees over the whole network. That is to find out the percentage of nodes in a network with a particular degree. For example, if most of the nodes in a network tend to have the same degree, then the degree distribution may look like a Gaussian distribution.
The extent to which nodes in a graph tend to cluster together can be quantified using clustering coefficient . It has been shown that most of the real-world networks have nodes with high clustering coefficient, i.e. nodes in these networks tend to have neighbors that form a clique. Another commonly used graph theory metric is the mean path length, which is simply the average shortest path between two nodes.
A network having large clustering coefficient and low mean path length are classified as small-world networks. Other classes of networks include regular networks, where each node has the same number of edges and random networks which are formed by constructing every edge independent of every other edge with a probability p. An example of this is the famous Erdös-Renyi random network. Random networks are also characterized by small mean path length. Another class of network known as a scale-free network exhibits the property that its degree distribution obeys a power law. Some visualizations of these networks are shown below:
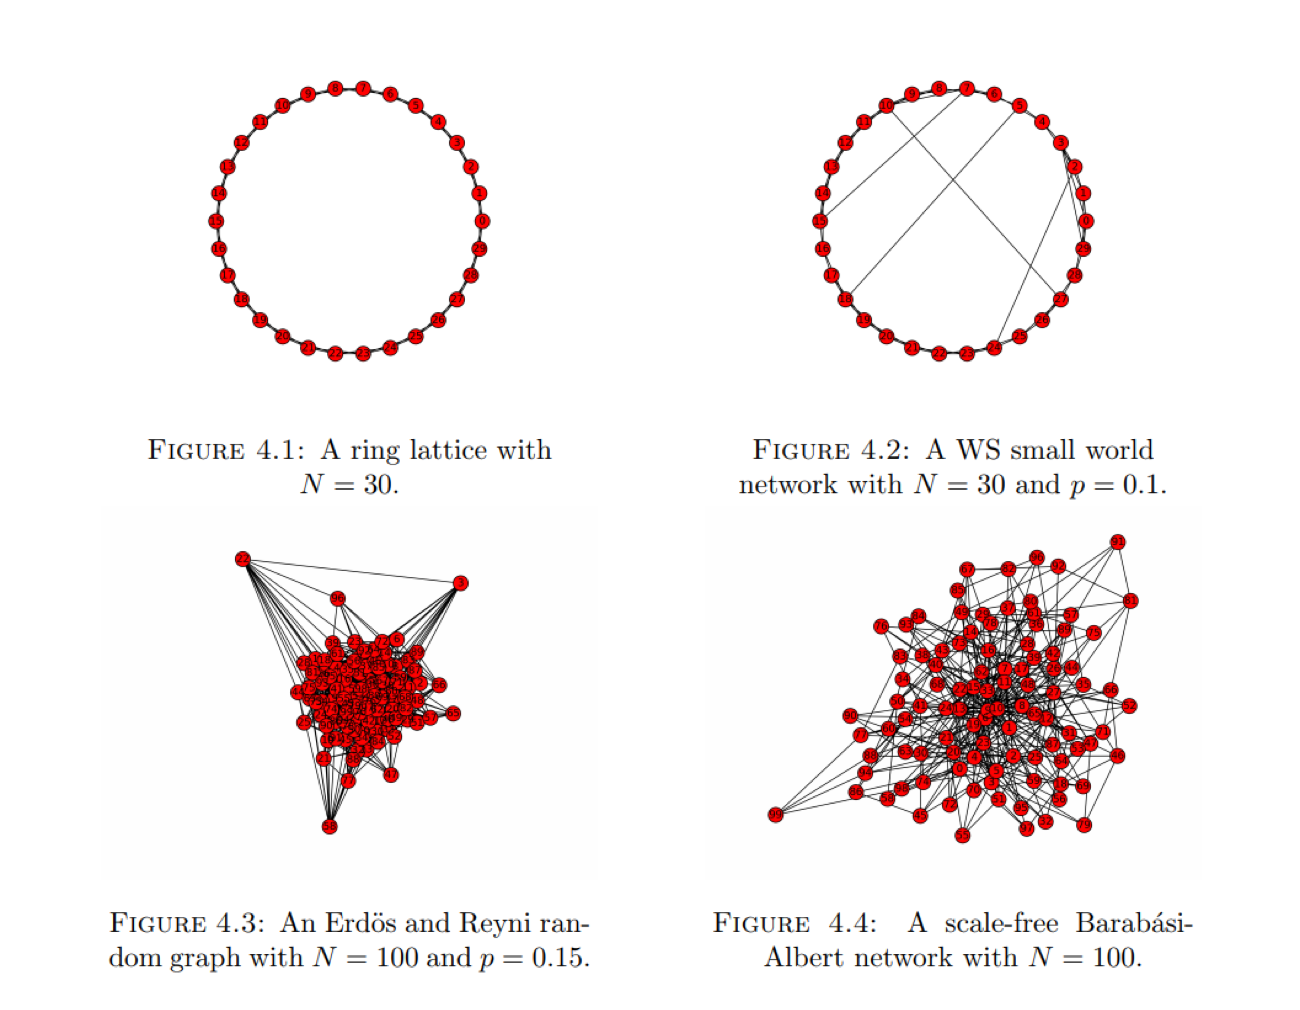 Figure from [3]
Two common graph theory/network analysis packages are Networkx (in Python) and Brain Connectivity Toolbox (in MATLAB)
References
[1] De Vico Fallani, Fabrizio, et al. “Graph analysis of functional brain networks: practical issues in translational neuroscience.” Philosophical Transactions of the Royal Society B: Biological Sciences 369.1653 (2014): 20130521.
[2] Cao, Qingjiu, et al. “Probabilistic diffusion tractography and graph theory analysis reveal abnormal white matter structural connectivity networks in drug-naive boys with attention deficit/hyperactivity disorder.” Journal of Neuroscience 33.26 (2013): 10676-10687.
[3] Puthanmadam Subramaniyam N. Recurrence network analysis of EEG signals: A Geometric Approach. Tampere University of Technology, 2016. 151 p. (Tampere University of Technology. Publication).
Download this paper.