It is yet unclear which features of the EEG signal are the most informative about brain states and outcomes. A new complexity measure with different assumptions does a better job of predicting cognitive performance than conventional entropy and complexity measures.
The EEG literature shows correlations between various metrics and mental states or outcomes. However, thus far there are few metrics that have very clear diagnostic and predictive potential at an individual level so there is always motivation for new ways of looking at the EEG signal – particularly new metrics which diverge or have high variance across individuals have a better chance of being discriminating of brain states and outcomes. Here we describe a new measure of complexity of the signal that may do better than other entropy/complexity measures out there (Parameshwaran et al, J Neurosci Methods, 2019). Essentially, this metric, called waveform complexity, (CW), describes the diversity of waveform patterns in the signal in the time domain in a manner that is not based on a narrow spectral band.
How it works
Computing Cw is pretty simple. It involves
- randomly choosing non overlapping segments of the signal
- comparing how similar they are in their waveform shape using a correlation measure r. (the correlation measure is pretty independent of amplitude so it is a measure of similarity of the waveform shape)
- Computing the values of 1-|r|, essentially the diversity distribution of these of waveforms
- Finding the median of this diversity distribution.
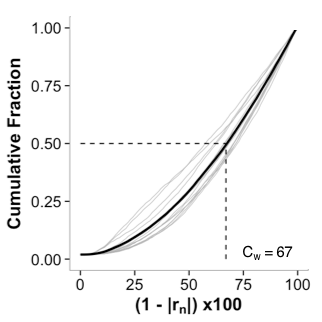
Figure 1: From [1]
This process requires a few key assumptions:
- The length of segments of the signal – 750 ms was found to be an optimal since it was the duration where there was maximal variance across individuals.
- The number of segments to sample – in general in order to get a maximal number of comparisons, ~40% of the total signal should be sampled. Less than that and you are not sufficiently sampling the signal. More than that and you are limiting the ways you can segment the signal.
- The length of the signal you can apply this metrics to – in general if you are computing this metric on signals less than a minute in duration its unstable so you would want a signal ideally at least 2 minutes long.
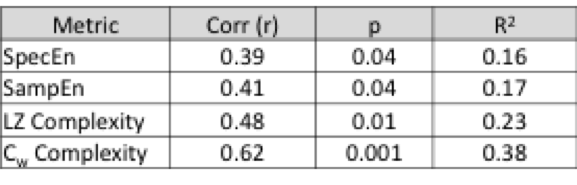
Better than other Entropy/Complexity Metrics
There is some evidence that this metric might a) have some relevance to cognition and b) do better than other entropy/complexity metrics (all of which are algorithms applied to time series that attempt to quantify variability in the signal) – it had a much better correlation to scores on a pattern recognition task than other entropy measures.
How it’s different from other Entropy/Complexity metrics
While all entropy and complexity metrics applied to time series are trying to quantify variability, the differences arise in assumptions about what aspect of the signal is worth quantifying. Entropy measures do this by trying to compute a diversity metric based on the probability distributions of ‘events’ within the signal. However the challenge is that when applied to time series arising from a complex (or large interconnected) system such as the brain, where the underlying generator of the signal is not fully understood (see related post What Does the EEG Signal Measure?), the primary challenge is that the nature of what constitutes a meaningful event or feature is not clear. Sample entropy and its derivative multiscale entropy for example involves defining a length scale of an event (typically 2 or 3 data points), a distance measure to compare two events (typically a euclidian distance which becomes computationally expensive for long segments), and selecting a threshold of similarity that defines when two events are considered the same. The measure proposed here compares waveform shape on a relatively long time scales without introducing a threshold parameter for comparison. However, whether or not these assumptions are relevant to the underlying signal is important and there are many ways in which these assumptions can grossly misconstrue what is relevant. One way to think about this is the following:
If you were computing the complexity of an audio signal of speech and you knew it was human language, it would obviously make sense to define ‘events’ by the pauses between words, which can each take something on the order of 100 to 500 ms to say, but vary quite a bit from word to word. However, not knowing this, you are pretty much guessing. If you picked 5 ms, you would get some number, but it would be meaningless. That’s in the time domain. If you did a spectral transformation you would even lose all the ‘word’ content – which is a feature of the time domain. This would be even more distorting of what you are really trying to determine. Secondly, what constitutes a similar ‘event’? Similar sounding segments such as ‘pat’ and ‘bat’ can mean different things but nonetheless be defined as the same simply because they sound the same. When you are stabbing in the dark therefore, as we are with a signal like the EEG, it merits a wide exploration of features and methods of comparison. Finding a metric that does better in terms of discriminating brain states can then provide some clues about what is important in the signal.
References
Parameshwaran et al., Waveform Complexity: A New Metric in EEG Analysis J Neurosci Methods 2019