EEG Microstates are generally identified using clustering algorithms and results can vary depending on choice of algorithm and parameters.
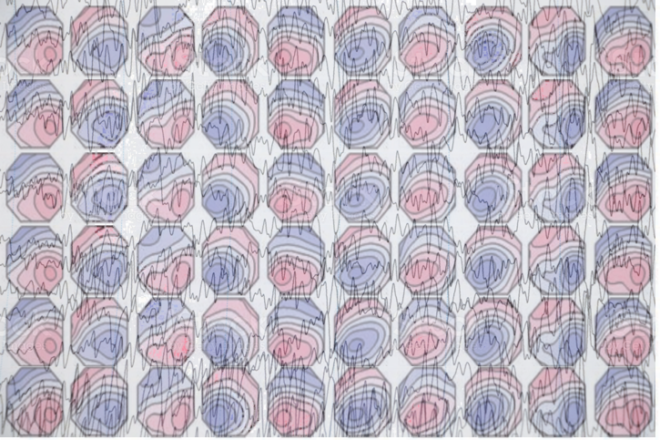
In the last post I introduced the concept of EEG microstates. Here I discuss methods to identify these microstates. Essentially, given a wide array of topographic maps, how do we find a group of maps that account for the most variance in the data?
Using a Modified K-Means Clustering
One way to obtain a solution to this problem is to use clustering techniques. Pascal Marqui et al. [1] suggested using a modified K-means algorithm to obtain most prototypical topographies. The algorithm is similar to the standard K-means algorithm and begins by randomly choosing K topographic maps at the start (for example K = 2 below).
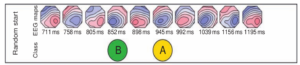
Figure 1 : Random start in the modified K-means algorithm, where two topographies are randomly chosen to be the initial two classes [2].
The first iteration computes the similarity (for example using spatial correlation) of every topographic map with these K maps. It is important to note here that, while dealing with resting-state EEG, the polarity of the maps is ignored, i.e., the sign of the spatial correlation is not considered and their squared values are used instead. It has been shown that the topographic maps at successive times of the GFP peaks show similar configurations, with reversed polarity [2,3]. (GFP refers to the global field power and is computed as the root mean square across average-referenced electrode values at a given time instant). Each of the topographic maps are then assigned to one of the K classes based on similarity and new K classes are formed, for instance by computing the average of all topographic maps belonging to each class.
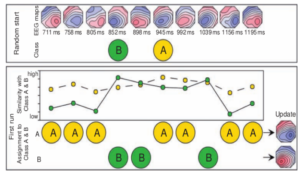
Figure 2 : During the first run of the algorithm, topographies are assigned to either of the two classes based on similarity (spatial correlation) [2].
The process is again repeated until convergence, i.e., until no further change in assignment is observed.
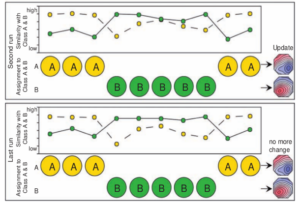
Figure 3 : The iterative algorithm is run until convergence [2].
Alternate Clustering Approaches
Other clustering algorithms such as principal component analysis, hierarchical clustering or agglomerative clustering, Gaussian mixture models can also be used to find the prototypical maps. Most of the research analyzing resting-state EEG using modified K-mean algorithm have used K=4. Although , modified K-means clustering algorithm has been widely used to obtain microstate classes, one of the limitations or shortcomings of this approach is that the number of clusters must be specified a priori. There are several methods such as cross validation, Krzanowski and Lai criterion, to mention a few which can also be used to find the optimal number of clusters. But as it is the problem with any clustering algorithm, deciding on the optimal number of clusters always comes with a trade-off – the trade-off between the number of clusters and their quality and each of these criterion have their own weakness. This is one of the limitation of the method as it eventually depends on the clustering algorithm chosen to find the microstate classes and since there are several ways to do clustering and to decide on the number of clusters, there may be quite a bit of variability in the results when applied to the same data.
A Comparison of EEG Microstates Obtained with Various Clustering Approaches
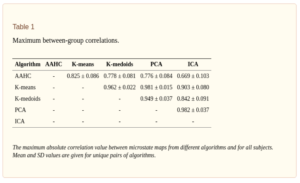
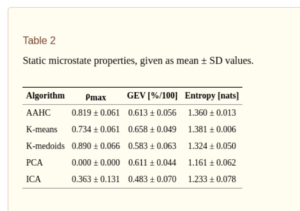
A recent study by Wegner and colleagues [4] compared various measures (Ex. Correlation, entropy, Hurst exponent etc) of resting state EEG microstates derived from five different clustering algorithms such as K-means, ICA, PCA, K-Mediods and agglomorative hierarchical clustering (AAHC), where each algorithm was restricted to give four microstate classes. Results from 20 resting state EEG data showed that static properties such as maximum inter-group correlation (table I below) and intra-group correlation, global explained variance, entropy (Table II) depend to some extent on the choice of the clustering algorithm, show statistically significant differences between algorithms. Maximum inter-group correlation here refers to the maximum correlation between the microstate maps of two clustering algorithms. Maximum intragroup correlation (Table II , second column) refers to the maximum correlation value between the four maps produced by each clustering algorithm (Note that PCA obviously has zero correlation between its maps as by construction the principal components are decorrelated!). From Table I, we can also infer that the correlation between the maps produced by different algorithms are quite high (0.7 to 0.9), with results showing that there is at least one highly similar map combination found in both algorithms.
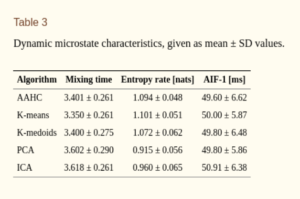
Since microstates also evolve over time, one can define several properties, including information theoretical measures, characterizing their temporal dynamics such as entropy rate, autoinformation peaks (AIF) , mixing time of transition matrix, Markov property etc. Results from [4] show that these measures do not seem to depend on the choice of the clustering algorithm, giving no statistically significant difference between different alorithms.
Thus, it is better to characterize the obtained microstates with dynamical properties and information theoretical measures rather than using standard static measures to reduce the bias from the choice of clustering algorithm. However, it has to be noted that the aforementioned study used only 20 subjects and the number of clusters were restricted to four. Also, most of measures used (such as entropy rate ect) are only valid for stationary time series, while EEG is highly non-stationary.
Expressing Global Field Power as Sequences of Microstates
Finally the obtained microstate classes are assigned to each timeframe of EEG signal (to which it has the highest spatial correlation), with minimum segment duration, as shown below,
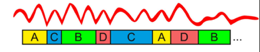 Figure 4 : After clustering step, the EEG signal (GFP) is re-expressed as a sequence of microstate classes [3].
The point of minimum duration is important to note here, because if we look at the third in microstate sequence, i.e. the class B, or the fifth in the sequence of microstates, i.e. the class C, we notice that there is a GFP minimum occurring , before it switches back to GFP maxima. Without the constraint of minimum duration, a new microstate would have been assigned at these minima, which typically have very low SNR. Thus, having a constraint (for example minimum duration of 10 or 20 ms) avoids this scenario.
Microstate analysis of ERP
Unlike resting-state EEG, which typically has low SNR, event-related data is averaged over multiple trials and thus has good SNR. In extracting microstates from ERP data, GFP need not be computed and instead grand averaged data can be used. Another difference between microstate analysis of resting-state and ERP data is that, in the case of ERP data, polarity of the topographies is considered. Microstate classes can then be obtained using clustering algorithms such as K-means algorithm.
Microstate statistics
After obtaining the microstates, several statistics such as average duration, average number of microstates per second, global explained variance (i.e. how well each prototypical microstate explains the data), average GFP during a state and the transition probabilities (Markov chain) between microstates can be computed.
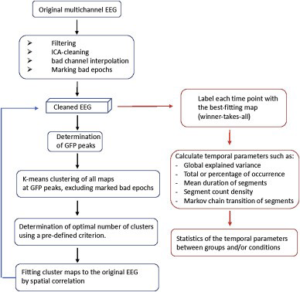
Figure 5 : Steps involved in microstate analysis. From [9]
References
[1] Pascual-Marqui RD, Michel CM, Lehmann D. Segmentation of brain electrical activity into
microstates: model estimation and validation. Biomedical Engineering, IEEE Transactions on.
1995; 42:658–665.
[2] Michel, C. M., Koenig, T., Brandeis, D., Wackermann, J., & Gianotti, L. R. (Eds.). (2009). Electrical neuroimaging. Cambridge University Press.
[3] Khanna, A., Pascual-Leone, A., Michel, C. M., & Farzan, F. (2015). Microstates in resting-state EEG: current status and future directions. Neuroscience & Biobehavioral Reviews, 49, 105-113.
[4] Von Wegner, Frederic, Paul Knaut, and Helmut Laufs. “EEG microstate sequences from different clustering algorithms are information-theoretically invariant.” Frontiers in computational neuroscience 12 (2018): 70.
[5] Michel, Christoph M., and Thomas Koenig. “EEG microstates as a tool for studying the temporal dynamics of whole-brain neuronal networks: A review.” Neuroimage 180 (2018): 577-593.