
What are the common approaches to measuring depth of anesthesia in clinical application and how do we evaluate the algorithms used?
Monitoring the depth of anesthesia (DoA) in real-time during clinical surgery is crucial. If the depth of anesthesia is not appropriate, patients may experience intraoperative awareness, resulting in symptoms of post-traumatic stress disorder in up to 70% of such patients [ 1]. On the other hand, if the depth of anesthesia is too deep, postoperative recovery can be delayed, potentially causing harm to the neural system and even increasing postoperative mortality [ 2].
The use of electroencephalography (EEG) has become popular in the field of anesthesia to quantitatively assess the depth of anesthesia during surgical procedures. Figure 1 shows changes that would be observed in an EEG upon sedation.
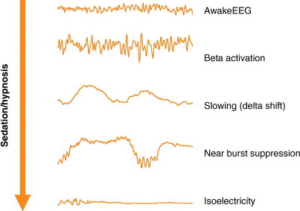
Figure 1. Changes in EEG upon sedation/hypnosis [3].
Several commercial devices are available to monitor the depth of anesthesia that use various quantitative EEG algorithms to convert EEG output into a numeric scale or letter category, which can be used by anesthesiologists in real-time to guide anesthesia dosing, prevent unintended operative awareness and avoid light or overly deep anesthesia. These include BIS (Based on BIS index by Medtronic, USA), Narcotrend (Based on spectral analysis and pattern recognition by Narcotrend-Gruppe, Germany), Entropy (Based on entropy measures by GE Healthcare) and SEDLine (Based on spectral analysis by Masimo Corporation), each of which are described below.
Bispectral index (BIS)
The BIS is a dimensionless index that is calculated from the EEG signal and ranges from 100 (meant to indicate fully awake) to 0 (meant to indicate no EEG activity) and used in commercial products. During anesthesia, values between 40 and 60 are recommended to minimize the likelihood of awareness and avoid deep anesthesia and its side effects. A sub-parameter known as suppression ratio (SR) is also given by the BIS algorithm. The SR is an estimate of the level of burst suppression , describing the percentage of the preceding 63-second EEG trace that is isoelectric. It is shown to correlate strongly with burst suppression calculations taken from standard EEG recordings [4].
BIS is a proprietary algorithm and full details on how exactly this parameter is computed is not available although it is supposed to depend on the bispectrum which is the difference in phase calculated between signals at various frequencies. A recent study claims to have reverse engineered the algorithm and surprisingly, found that the BIS score as calculated by their implementations does not depend on the bispectrum as advertised but that BIS values are mostly controlled by signal power in the lower gamma bands (30–47 and 40–47 Hz) [5]! However, since the original BIS algorithm is not made public it is hard to come to any conclusion on how BIS is exactly calculated.
Entropy-based measures
It is believed that EEG can be better described using non-linear dynamics than simple linear measures such as power spectral analysis.. One way to measure non-linear dynamics is by using entropy. Several variants of entropy measures both in time and frequency domain including spectral entropy, sample entropy, approximate entropy etc have been used to measure the DoA. For example, spectral entropy, which is a measure of the regularity of the frequency of EEG signals, is obtained by applying Shannon entropy to the power spectrum of EEG. The DoA monitor developed by GE Healthcare splits the spectral entropy into relative entropy (RE), which is a measure that looks at brain activity and muscle activity in the frequency range from 0 to 47 Hz and state entropy (SE), that only looks at brain activity in the frequency range from 0 to 32 Hz. These indices are then used to categorize EEG as shown in Figure 2.
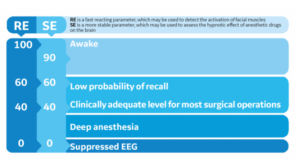
Figure 2 : EEG classification based on RE and SE [6].
Spectral edge frequency (SEF)
The SEF is a measure of the frequency at which a certain percentage of the total EEG power is concentrated. For example, the SEF90 and SEF95 are derived by calculating the frequency that separates 90% and 95% of the area of the power spectrum from the 10% and 5% of the area, respectively. Lower SEF values indicate a deeper level of anesthesia. However, it’s pointed out that the SEF is heavily dependent on filters applied to the raw EEG signal and it poorly reflects the center of the power spectrum distribution and the activities in the low frequency bands. It also compresses the EEG waveform into a single number, losing information on slower EEG frequencies. Studies have shown that SEF can correlate closely with serum concentrations of certain anesthetics like thiopental, etomidate, and fentanyl, but it can also hide shifts in EEG activity from alpha band to low frequency bands.
Median frequency (MF)
Median frequency is defined as the frequency of a power spectrum at which 50% of the power is at lower frequencies and 50% of the power is at higher frequencies. The MF was one of the first processed EEG measures introduced to clinical use and typically, the median frequency of awake patients is at a level of 12 Hz. During anesthesia, the median frequency shifts to lower levels, with frequencies of about 2-3 Hz being found, i.e., lower MF values indicate a deeper level of anesthesia. Studies have shown that MF is effective in quantifying depth of anesthesia with various anesthetics, and it was found to perform better compared to spectral edge frequency when etomidate was used. However, some studies suggest that a complex multimodal distribution like the EEG power spectrum cannot be described by a single value, but gross shifts in the power spectrum can reasonably be determined utilizing the MF.
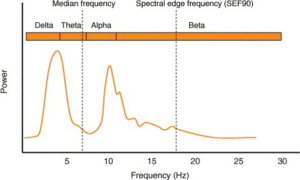
Figure 3. Illustration of an EEG power spectrum. The MEF is the frequency that divides the power spectrum curve into half. SEF80 divides the curve into 90% and 10% [3 Tonner and Bein 2006].
Evaluating the algorithms
As mentioned before, the exact algorithmic details used in these devices are not known as they are proprietary, although some information is available on the type of EEG measures they use to arrive at a single number/letter. In addition to the ones described new algorithms continue to be proposed to measure the depth of anesthesia. Most of these measures are similarly based on entropy/complexity analysis and power spectral analysis [for example see 7-9].However several factors such as the patient’s age, sex, medical history, and the type and dose of anesthetic agents used can affect the EEG signal and therefore it can be challenging to accurately interpret these signals and use them to determine the patient’s level of consciousness. Large scale validation studies accounting for these factors do not exist and the proposed methods are usually tested on smaller sample sizes and not accounting for the factors mentioned above. Furthermore, there is a lack of standardized protocols for monitoring and interpreting these signals, which can lead to inconsistencies in the data and results.
How can we effectively measure the success of these measures? One way is to look at the certain clinical outcomes. These can include the incidence of awareness during anesthesia, postoperative cognitive dysfunction (POCD), postoperative delirium, and occurrence of postoperative complications, including mortality. Additionally, the duration of postoperative recovery, length of hospital stay, and the cost of postoperative care can also be used as indicators of postoperative outcomes. In a subsequent blogpost we will look at known evaluations to outline the present day success and remaining challenges.
References
- Leslie, Kate, et al. “The effect of bispectral index monitoring on long-term survival in the B-aware trial.” Anesthesia & Analgesia 110.3 (2010): 816-822.
- Wang, Gang, et al. “Monitoring the depth of anesthesia through the use of cerebral hemodynamic measurements based on sample entropy algorithm.” IEEE Transactions on Biomedical Engineering 67.3 (2019): 807-816.
- Tonner, P. H., and B. Bein. “Classic electroencephalographic parameters: median frequency, spectral edge frequency etc.” Best Practice & Research Clinical Anaesthesiology 20.1 (2006): 147-159.
- Cottenceau, Vincent, et al. “The use of bispectral index to monitor barbiturate coma in severely brain-injured patients with refractory intracranial hypertension.” Anesthesia & Analgesia 107.5 (2008): 1676-1682.
- Connor CW (October 2022). “Open Reimplementation of the BIS Algorithms for Depth of Anesthesia”. Anesthesia and Analgesia. 135 (4): 855–864. doi:10.1213/ANE.0000000000006119. PMC 9481655. PMID 35767469.
- https://clinicalview.gehealthcare.com/quick-guide/entropy-monitoring-valuable-tool-guiding-delivery-anesthesia
- Ferenets, Rain, et al. “Comparison of entropy and complexity measures for the assessment of depth of sedation.” IEEE Transactions on Biomedical Engineering 53.6 (2006): 1067-1077.
- Wei, Qin, et al. “Analysis of EEG via multivariate empirical mode decomposition for depth of anesthesia based on sample entropy.” Entropy 15.9 (2013): 3458-3470.
- Zhang, X-S., Rob J. Roy, and Erik W. Jensen. “EEG complexity as a measure of depth of anesthesia for patients.” IEEE transactions on biomedical engineering 48.12 (2001): 1424-1433.