Many features of the EEG have been used to predict seizures. Here we explore their performance showing that linear features perform as well as non linear features and multivariate features outperform univariate ones.
In the previous blogpost we saw the fundamental challenges in predicting the occurrence of seizures accurately. Here we will focus on various approaches developed to predict seizures and how well they perform.
Linear and nonlinear features
Both linear and non-linear univariate measures, i.e. measures computed on a single-channel, have been extensively used in distinguishing inter-ictal from pre-ictal data. Most commonly used linear measures include power in different spectral bands (delta, theta, alpha, beta, gamma), different statistical moments of EEG amplitude (ex. mean, variance, kurtosis etc), to mention a few. These measures are easy to compute and hence optimal for real-time implementation.
It has been argued that the dynamics underlying brain activity is highly nonlinear and hence nonlinear features should be able to better distinguish subtle changes in the dynamics compared to linear features such as power spectral density or statistical moments. Since late the 80s to early 2000s, many non-linear measures such as Lyapunov exponent, correlation dimension, dynamical similarity, various estimates of entropy, to mention a few, were applied and most of these studies reported success in distinguishing pre-ictal from inter-ictal data.
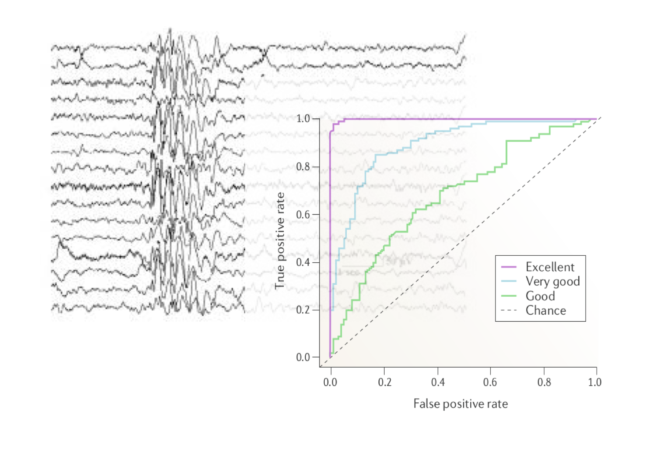
One the major studies in evaluating the performance of linear and nonlinear measures was carried out by Mormann and colleagues [1] . They compared 12 linear measures against 9 nonlinear measures using intracranial EEG data from five patients, which comprised of 46 seizures. For each measure, the amplitude distribution of the inter-ictal and pre-ictal values are obtained and compared using the receiver-operating-curve (ROC) to judge the separability (pre-ictal or inter-ictal) in terms of sensitivity (true positive rate) and specificity (1 – False positive rate). The area under the ROC is typically used as a metric to evaluate the prediction performance (Higher the area, better the performance). The figure below depicts how ROC would look like for various predictive performances (ranging from chance level prediction to excellent).
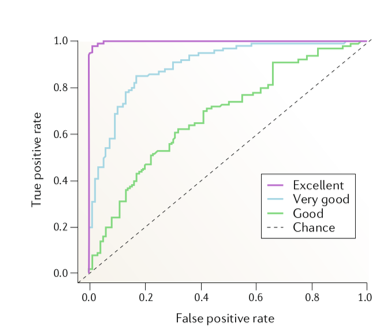 Figure 1 : Evaluating the predictive performance of algorithms with ROC [2].
They tested the performance of these measures under four different scenarios –
- All seizures, all channels.
- All seizures, each channel separately.
- Each seizure, each channel separately, constant baseline (i.e distribution of pre-ictal values for each seizure is tested separately against the distribution of the entire inter-ictal values of that channel).
- To account for slow shifts in the EEG dynamics, each seizure and each channel separately, adaptive baseline (i.e. pre-ictal distribution of each seizure is tested only against the interictal period preceding this seizure’s preictal period).
Their results showed that the best predictive performance was obtained for the fourth scheme, which indicates that univariate measures are most sensitive to changes before a seizure only in relation to the activity preceding these changes and thus cannot capture changes in dynamics at a much longer scale. That is to say, univariate measures are sensitive to changes minutes (approx. 5 to 30 minutes) before the seizure and not hours before a seizure. Within the univariate measures, it was found that linear measures had better specificity and sensitivity compared to the nonlinear measures as shown in figure below for the fourth scheme.
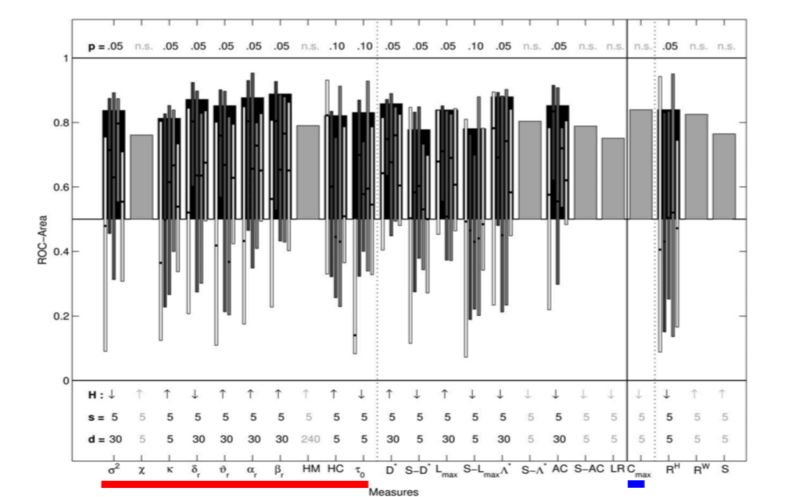
Figure 2: ROC area for linear (univariate underlined with red and bivariate underlined with blue) and nonlinear measures, for each channel and each seizure separately, with adaptive baseline (Adapted from [1]). The (statistically significant) mean values averaged over patients are shown in black bars with thin bars representing ROC area values for individual patients. The gray bars represent measures that were not statistically significant.
Univariate and multivariate features
Although univariate features (i.e. features computed using a single-channel) have been extensively used for seizure prediction, there is an overwhelming evidence about the involvement of epileptic networks, supported by studies that have shown changes in EEG signals far away from the seizure onset regions. Thus, a multivariate approach, looking at the interaction between signals recorded from different brain areas would seem more informative.
Bivariate and multivariate approaches such as phase synchronization, nonlinear inter-dependence, linear cross-correlation, that aim at estimating connectivity between EEG signals, have been used for seizure prediction. In the same study described above [1], Mormann and colleagues compared bivariate linear measure cross-correlation (C_max) with nonlinear bivariate measures such as phase coherence (compute with Hilbert Transform RH and wavelet transform RW), non-linear interdependence (S). They reported that bivariate measures showed changes at least 240 minutes before the seizure indicating that bivariate measures are sensitive to changes in dynamics at a longer scale compared to univariate measures.
Performance assessment
Assessing the performance of a seizure prediction algorithm can be done in two ways [3] –
1 ) Statistical : The amplitude distribution of the measures in two periods (for example inter-ictal vs pre-ictal) are compared, as described above (also see [1])
2) Algorithmic : Temporal profile of the underlying measure (linear, nonlinear etc) is obtained for every time point of a short window and if the measure crosses a certain threshold and a seizure occurs within a certain time interval (defined as prediction horizon), then this is classified as true alarm (true positive), else it is considered a false alarm (false positive). ROC curves can then be obtained for performance evaluation.
In-sample versus out-of-sample
Optimizing the parameters of a seizure prediction algorithm in order to achieve desirable performance is known as in-sample optimization [3]. For a prediction algorithm to be effective and clinically acceptable, it is imperative that the algorithm should perform well on the out-of-sample testing data. In-sample optimization typically results in overestimation of performance , which is not reproduced when tested on new data for which the parameters of the algorithm may no longer be optimal.
For a detailed comparison of various measures, along with type of performance assessment (statistical vs algorithmic), parameter optimization (In-sample or not), and sensitivity and specificity rates see [3].
Summary
- Linear methods seem to work as well as, and in some cases, better than nonlinear methods.
- Multivariate/bivariate metrics outperform univariate ones in terms of detecting changes at longer time scales.
- Out-of-sample testing on independent data should be carried out to assess the true performance of a prediction algorithm.
Considerable progress has been made in the development of seizure prediction algorithms, that have shown impressive results in terms of specificity and sensitivity. The rapid development of machine and deep learning techniques have been exploited to further this cause. However, often these results don’t extend to external datasets such as those provided in competitions, a challenge that may be due to datasets having different ways of manual seizure annotation across research groups. Another hurdle to overcome is to enable algorithms to perform with greatly reduced computational power so that they can be used in embedded devices, in real-time.
See the Temple University Hospital EEG Corpus for a large repository of seizure records.
References
[1] Mormann, Florian, et al. “On the predictability of epileptic seizures.” Clinical neurophysiology 116.3 (2005): 569-587.
[2] Kuhlmann, Levin, et al. “Seizure prediction—ready for a new era.” Nature Reviews Neurology 14.10 (2018): 618-630.
[3] Mormann, Florian, et al. “Seizure prediction: the long and winding road.” Brain 130.2 (2007): 314-333.