The slope that represents the decay of the EEG power spectrum carries important information about the signal that can eliminate many of the inconsistencies of working with narrow bands.
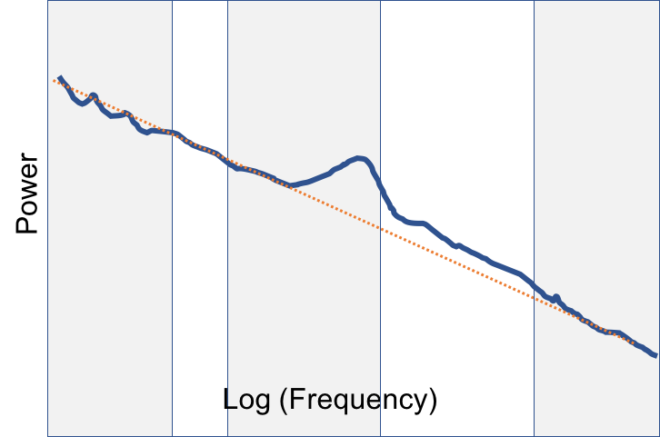
The power spectrum of the EEG has a fairly characteristic profile. Essentially the power systematically decreases with increasing frequency. This is called a 1/f spectra because if can generally be fit to a function of the form:
![]()
where the log of the function is a straight line with the slope -alpha which reflects the steepness of the decay and is the metric of interest.
Occasionally however there are peaks, which mainly arise in the alpha band, and sometimes the decay does not strictly fit a 1/f structure.
Generally, most studies ignore the structure of this decay in favor of the frequency bands delta, theta, alpha, beta, gamma. This has its perils for the many reasons outlined below. The decay metric however can replace this band based approach as a more comprehensive single measure.
The many problems of working with frequency bands
Frequency bands are a holdover of past instrumentation constraints. In the pre-computer era of the 1930s when measuring EEG was brand new and analysis was manual, the oscillatory element was called alpha and everything else that was heterogeneous and difficult to characterize was called beta. As the speed of the manual writing apparatus improved higher frequencies were detected which were called gamma. See Down a Rabbit Hole: A History of EEG Analysis
The bands are each heterogeneous Within the alpha band you can clearly detect the presence of oscillations embedded in the signal, using an autocorrelation for instance. However, even here it sits on top of a heterogeneous spread across the full range. In other bands it is rare to see any systematic rhythmic behavior. Further while some evidence exists for generators of alpha range rhythmic activity in the thalamus, there is no specific generators of ‘theta waves’ or ‘beta waves’ which pose a misleading nomenclature.
There is huge variability in how people define these bands: Since the bands in general don’t represent anything intrinsic to the system and are arbitrary elements of instrumentation, people have taken to defining bands in a whole mess of ways so that one paper’s beta is not the same as another’s. See The Remarkable Inconsistency of Frequency Band Definitions
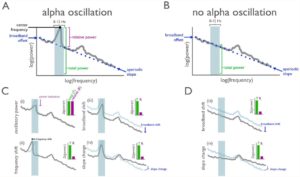
Changes in the decay or slope of the power spectrum can cause messy interpretations for particular bands. When the slope changes, depending on how you cut your bands you can get different results. In the image below if the point of intersection of the two spectral lines is exactly at the border between delta and theta you’ll get a nice increase in delta and decreases in the other bands. However if it falls right in the middle of a band then that band may show ‘no change’. It doesn’t mean that something special happened in that band while the other bands changed. Often this intersection occurs in the range of the theta band.

Characterizing the background decay
Characterizing the background decay involves two issues – (i) removing the peaks that arise and (ii) contending with some variation in the decay shape that can arise. The Voytek group has built some sophisticated curve fitting tools that deal with these that you can download here. It’s called fooof (fitting oscillations and one-over-f).
Here is also a figure from [1] which shows the line of the background decay that it fits (blue dotted line) and some examples of how changes in the aperiodic decay can influence results of narrow band analysis.

One way to think about this is that it provides a reflection of the relative proportion of higher frequencies to lower frequencies and is therefore a metric of the spectral energy of the system. A shallower decay or slope means a relatively higher ratio of high to low frequencies than a steeper slope and therefore higher spectral energy in the signal.
Some results using this metric
There is huge inconsistency in findings around the correlations of narrow bands to diagnostic criteria [see the Consistency of Resting State EEG Results in Mental Health Studies] . The background decay may help resolve some of the confusion. In fact the few early studies show it to be a better correlate of various mental health states. For example:
In ADHD the theta/beta ratio is thought to reflect symptoms of ADHD. Given that it is essentially a ratio of low to high frequency, it is a very rough approximation of slope or decay of the power spectrum and is therefore highly correlated with the slope measure. The slope measure is as well if not better correlated with ADHD diagnosis [2].
It appears to do better as a correlate of schizophrenia, where the slope is steeper in schizophrenia patients. The figure below from [3] shows that a classifier does better at separating schizophrenia patients (red). The accuracy was highest for slope alone (0.71). A model using all bands and only gamma had accuracy of 0.57. All bands + slope performed better than all bands alone but worse than slope on its own (0.64 accuracy) which would be expected if slope and band power are collinear.

In our work we have found that it relates strongly to various stimulus related factors such as level of education and travel where those with higher stimulus access have shallower decays. Bottom line, the slope is an important parameter that can replace most of the band analysis other than the oscillation peaks and given its relationship to mental states, the term 1/f ‘noise’ itself is probably very misleading.
References
[1] Haller M, Donoghue T, Peterson E, Varma P, Sebastian P, Gao R, Noto R, Knight RT, Shestyuk A, Voytek B. Parameterizing neural power spectra. bioRxiv, 2018.
[2] EEG Power Spectral Slope differs by ADHD status and stimulant medication exposure in early childhood. Robertson MM, Furlong S, Voytek B, Donoghue T, Boettiger CA, Sheridan MA. J Neurophysiol. 2019
[3] Peterson EJ, Rosen BQ, Campbell AM, Belger A, Voytek B 1/f neural noise is a better predictor of schizophrenia than neural oscillations bioRxiv, 2017.


Interesting digest of an important emerging topic in eeg. I think it’s relevant to link as well to a previous Sapien lab post, on the use of the Eeg spectral exponent (Aka PSD slope) to disentangle unconsciousness from unresponsiveness across three different anesthetics. The post relates to a recent seminar talk openly available on YouTube, and to its companion open access paper on neuroimage.
https://youtu.be/d7csRxa1nCI
https://doi.org/10.1016/j.neuroimage.2019.01.024
https://sapienlabs.org/eeg-and-depth-of-anesthesia/
See also this digest on the Psd slope and its use in anesthesia