Assessing phase locking in the signal between two electrodes is often used as a method to assess functional connectivity. Here is a look at how it works and its various pitfalls and caveats.
In the previous blog post we discussed how coherence can be used to define inter-dependencies between a pair of brain signals. Since coherence is essentially computed using cross spectral density estimate, this connectivity metric depends on both the magnitude and phase of the signals at hand. Thus, it is difficult to untangle the contributions of amplitude and phase to the computed coherence value. Due to this ambiguity, measures that discard the amplitude and focus only on the phase have gained popularity. One such measure is phase locking value (PLV), which is most commonly used owing to its simplicity.
Phase locking value
Lachaux and colleagues proposed a functional connectivity metric known as phase locking value (1), that depends on the instantaneous phase of the signals. The underlying assumption here is that if two brain regions are functionally connected, then the difference between the instantaneous phases of the signals from these brain regions should remain more or less constant. Since, instantaneous phase (see below) has physical interpretation only for narrowband signals, the first step in computing the Phase Locking Value or PLV is filtering. Given multiple trials or epochs of narrowband filtered brain signals from two EEG channels, the phase locking value can be defined as

Where N is the number of trials and theta(t,n) is the difference between the instantaneous phase of the two signals at time t and trial n. Thus computing PLV requires first filtering the data in the frequency band of interest and then extracting the instantaneous phase via Hilbert transform, which transforms the real signals into a complex representation. PLV takes values in the range of [0, 1] where a PLV of 0 implies that there is no phase synchrony and a PLV of 1 implies that the relative phase between the two signals is identical across the trials.
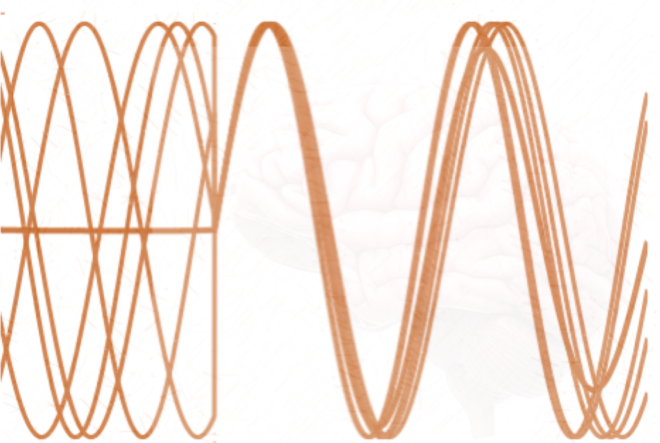
In order to find PLV values that are statistically significant, surrogates can be used, where trials are shuffled in one of the channels. The figure below summarizes this procedure.
 Figure from (1)
Instantaneous phase
What is instantaneous phase and how can it be extracted ? If you remember your Fourier transform, you know that the spectrum obtained from a real-valued signal x(t) is symmetric at 0 Hz , i.e., both positive and negative frequencies are present. Negative frequencies make sense mathematically, but don’t mean anything physically and are redundant. One way to get rid of these negative frequencies is obtain what is called as an analytic signa a(t),
a(t) = x(t) + i*q(t)
Where x(t) is the real-valued signal and q(t) is the Hilbert transform of x(t) and i = sqrt(-1). It turns out that the Fourier transform of a(t) is one-sided. The instantaneous phase can then simply be obtained as the angle between the real and imaginary part of the analytic signal, i.e., arg [a(t)]. Instantaneous amplitude is simply the absolute value of a(t), i.e. |a(t)|. As an example, let x(t) = cos(ω1 * t) + cos(ω2 * t + 0.7) , with ω1 = 2*π*0.25 and ω2 = 2*π*0.1, i.e., cosines of frequency 0.25 and 0.1 Hz . Using the hilbert command in MATLAB, which gives the analytic signal and computing its amplitude and phase using the abs() and angle() commands respectively we get the following

Some Math! (Feel free to skip)
Briefly, what Hilbert transform does is to shift the signal for all the positive frequencies by -π/2 and negative frequencies by π/2. To see why this makes sense, let us consider a cosine signal, x(t) = 2cos(ωt). Using Euler’s identity, we can rewrite x(t) as,
x(t) = e^(iωt) + e^(-iωt)
Taking the Hilbert transform we have
H{x(t)} = q(t) = e^(iωt-π/2) + e^(-iωt+π/2) = –ie^(jωt) + ie^(-iωt)
After substitution, the analytic signal becomes
a(t) = x(t) + i*q(t) = 2e^(iωt)
Thus, practically speaking, the analytic signal has twice the gain at positive frequencies of the original signal!
Pitfalls and Caveats
Although PLV is extremely simple to implement, there are many pitfalls one should be aware of. Few of the important issues regarding its application are
- First and foremost, the idea behind PLV rests on an assumption that connected regions have constant phase difference. This may not be the case. A more likely scenario may be intermittent phase locking. Consequently the results may vary depending on the length and period of the signal used.
- Obtaining a non-zero PLV is not necessarily an indication of phase synchrony but can instead be a consequence of volume conduction if PLV is computed directly on the sensor data. Due to volume conduction, a single source can be seen by both the electrodes resulting in spurious PLV (2). Additionally, use of common reference in EEG also leads to false phase locking.
- PLV can also be computed in the source-space after solving the EEG inverse problem. This mitigates the issues related to volume conduction and reference electrode problem to some extent, however spurious PLV can still occur due to source leakage as source estimation obtained on the points of the cortical surface are not fully independent. In addition, there are embedded assumptions in solving the inverse problem that introduces its own pitfalls and caveats.
- Given the non-sinusoidal nature of neural oscillations, narrowband filtering and extraction of phase using FFT and Hilbert transform may lead to erroneous results. Recently Cole et al. proposed to compute phase in time-domain (3) . However, the issue with narrowband filtering remains. See pitfalls of filtering the EEG signal.
- Since computing the analytic phase involves normalization of the signal with its envelope, this may induce spectral components outside the filtered bandwidth and any overlap in these spectral components may lead to spurious value of PLV even if there is none (4).
 Figure from (4)
Consider a signal with 10 Hz and 12 Hz frequencies as shown in top left, whose envelope varies at 2 Hz. Its spectrum is shown on top right. The figure in the left middle panel shows the signal using with the amplitude normalization is done. Note that this signal will have spikes where the original signal envelope has zero values. As a consequence, it’s spectrum now contains all harmonics of 2 Hz (right middle panel). In the bottom left panel we see the amplitude normalized signal and its spectrum. Due to these harmonics, spurious PLV may be obtained if they overlap with the signal from the other channel!
- Lachaux, Jean‐Philippe, et al. “Measuring phase synchrony in brain signals.” Human brain mapping 8.4 (1999): 194-208.
- Aydore, Sergul, Dimitrios Pantazis, and Richard M. Leahy. “A note on the phase locking value and its properties.” Neuroimage 74 (2013): 231-244.
- Cole, Scott R., and Bradley Voytek. “Cycle-by-cycle analysis of neural oscillations.” bioRxiv (2018): 302000.
- Kovach, Christopher K. “A biased look at phase locking: Brief critical review and proposed remedy.” IEEE Transactions on signal processing 65.17 (2017): 4468-4480.