Granger causality is an estimation of causality in time series that depends on linear methods. Does it have relevance to the nonlinear, non-stationary EEG signal and how would we interpret it?
Inferring causality is an important problem in many fields of science, including neuroscience. Estimating directional interaction between brain regions in neurophysiological recordings like EEG and ECoG can provide valuable information for understanding many neurological disorders such as epilepsy, Alzhiemer’s disease and schizophrenia. One method that has been used to determine causality is Granger Causality. How well can this work for EEG?
The basics of Granger Causality
Clive Granger introduced the method of Granger causality in the 1960s in the context of analyzing economic time series which won him the Nobel prize in Economics [1]. Here’s how it works:
A process Y is said to Granger cause X if we can predict X better by incorporating the past information of Y using linear regressive modelling. Here let’s say you try to predict x(t) from the autoregression on its past,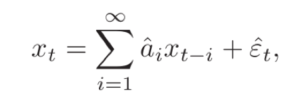
Where {a(i)} is the autoregressive coefficient and epsilon(t) (with the hat) is the prediction error. If another observation Y is also available, then you can also try to predict as
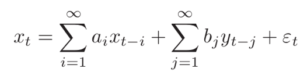
Where, a(i) and b(j) are regressive coefficients and epsilon(t) is the prediction error. The prediction error is essentially an indication of the quality of the prediction. The smaller the error the better the prediction.
The Granger causality from Y to X is defined as,
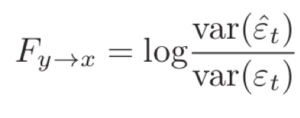
This essentially considers the variance of the errors when you use only the past time points of x to the variance of the errors when you use the past time points of both x and y to predict x(t). When the variance of the errors is small it means your regressive coefficients are reliably estimated and the prediction is good. Thus, if including the past of Y improves the prediction of X, then the ratio of the error variance will be >1 and the value of the log (the above statistic) will be greater than zero. If it does not improve the prediction of X, then the above statistic vanishes to zero.
Multivariate extensions of Granger Causality
We are not getting into these here in detail but take note that apart from inferring causality between two time series, extensions of Granger causality to infer causality from multivariate data have also been proposed, such as partial coherence (PC), partial directed coherence (PDC) , directed transfer function (DTF), to name a few. These measures are an extension of the coherence measure (blog link for coherence) to handle multivariate data [3] and are estimated within the framework of multivariate linear autoregressive modeling (i.e., extending the above two variable regressive model to account for multiple variables). One of the important steps here involves identifying the model order, i.e. the amount of past information (in terms of time lags) to include for prediction. This is typically done using Akaike information criterior (AIC) or Bayesian information criterion (BIC). A very high model order implies higher number of coefficients to be estimated (for an order p and M signals, the number of regressive coefficients are M2p)
Applying Granger Causality to EEG
Granger causality has been widely used for identification of directed interactions among neural time series in recent years [2]. However, fundamentally, as shown above, it assumes linearity and therefore cannot be used to characterize interactions in nonlinear systems [5]. Although if the underlying system has both linear and nonlinear connections, Granger causality measures are still sensitive to the linear parts (although very weak nonlinear connections may still be detected).
Most phenomena in nature are nonlinear and the human brain is no exception. EEG is essentially an output of a nonlinear dynamical system and various studies have shown that the dynamics and interaction of the EEG and other neural time series are highly nonlinear. Epiletic EEG recordings in particular have been shown to be better characterized with nonlinear time series analysis. Nonetheless there has been contrasting evidence on whether linear methods alone can sufficiently describe causal relations as applied to EEG data or if there is a need to use nonlinear methods. For instance, in [7] it was shown that both non-linear methods and linear autoregression models give good results (lower prediction error) when applied to EEG and ECoG signals.
However, the EEG signal used in this study was recorded from the scalp of two healthy subjects with their eyes closed, whereas ECoG was recorded from the hippocampus of one rat. This probably is not sufficient to justify the use of linear approaches over non-linear ones. As it is always the case, it really depends on the question. If there is a good reason to think that high the data would benefit from non-linear analysis (such as epileptic EEG or EEG recorded during anesthesia , to give few examples), nonlinear extensions can be tried and compared with the linear approaches to see what additional information they provide. Multivariate linear and nonlinear approaches may also provide complementary information as they assess different aspects of interdependencies between the signals. Which one is superior is probably a wrong question to ask. Linear approaches are easier to compute and should probably be the initial choice of analysis, which can further be complemented by nonlinear approaches.
Another limitation of Granger causality is that it assumes stationarity, while neural signals such as EEG are highly non-stationary. This can partly be mitigated by dividing the data into short windows, but then the challenge is to have enough data points within the window to reliably estimate all the auto regressive coefficients, and still maintain stationarity. As a rule of thumb, the number of data points should be 10-15 times higher than the number of coefficients to be estimated. Also it is important to note that these causality measures are not immune to any volume conduction present.
In summary, despite its limitations and assumptions, if there is a linear component of causality in the data, Granger causality can pick it up. Most of these measures can be readily computed within toolboxes such as FieldTrip or EEGLAB. That said, interpretation has to be cautious and very careful as it is riddled with pitfalls [7]. The important question is, does the linear, aspect of the signal really give you the most relevant picture of the behavior of non linear, non stationary brain signal?
References
[1] Granger, Clive W. J (2004). “Time Series Analysis, Cointegration, and Applications” (PDF). American Economic Review. 94 (3): 421–425
[2] Seth, Anil K., Adam B. Barrett, and Lionel Barnett. “Granger causality analysis in neuroscience and neuroimaging.” Journal of Neuroscience 35.8 (2015): 3293-3297.
[3] Baccalá, Luiz A., and Koichi Sameshima. “Partial directed coherence: a new concept in neural structure determination.” Biological cybernetics 84.6 (2001): 463-474.
[4] Sameshima, Koichi, and Luiz Antonio Baccala. Methods in brain connectivity inference through multivariate time series analysis. CRC press, 2016.
[5] Gourévitch, Boris, Régine Le Bouquin-Jeannès, and Gérard Faucon. “Linear and nonlinear causality between signals: methods, examples and neurophysiological applications.” Biological cybernetics 95.4 (2006): 349-369.
[6] Blinowska K.J., Malinowski M. (1991) Non-linear and linear forecasting of the EEG time series. Biological Cybernetics 66: 159-165
[7] Stokes, P. and Purdon, P. (2017) A study of problems encountered in Granger causality analysis from a neuroscience perspective PNAS 114 (34)
EEG is a linear signal, which was demonstrated e.g. by surrogate data tests e.g.: [1], [2}. Linear measures of dependencies between EEG signals perform better than non-linear ones [3,4,5]. Nonlinear measures are very sensitive to noise and are prone to arbitrary choices. They may be recommended only when there is a clear evidence of nonlinearity [6].
1. Ackerman et al. (1994) . Electroenceph. Clin Neurophysiol 90(5):384–387
2. Lopes da Silva FH et al. (1999) Clin Neurophysiol 110:1801–1813
3. Netoff et al. 2006 In: Schelter. eds) Handbook of time series analysis. Wiley-VCH, Weinheim
4. . Dauwels JF (210) NeuroImage 49: 668–693
5. Blinowska KJ Med Biol Eng Comput (2011) 49:521–529, DOI 10.1007/s11517-011-0739-x
6. Pereda et al (2005) Progr. Neurobiol. 77:1-37
Dear Dr. Blinowska, Thanks for your comment. There are contrasting studies regarding this and this also depends how exactly surrogate data is generated and what assumptions are made therein. Evidence of non-linearity has been demonstrated (with surrogate testing) in EEG data [1-5] and this as well scale dependent. Scalp EEG recorded from a large number of neurons as compared to ECOG or MEA, where non-linearity might be reflected much more strongly. It is indeed correct that the high-dimensional and noisy nature of EEG may limit the advantage of nonlinear analysis, however as you mention in case of clear evidence of non-linearity such as epileptic seizures, non-linear approach could be useful.
Thus, establishing conclusively the presence of nonlinear interactions or non-linearity in EEG signal is not straightforward. In general, a model-free approach that makes no implicit assumption about the data generating process, would be optimal for detecting causality from EEG data. Granger causality and their multivariate extensions assume a simple MVAR model, that may not fully identify nonlinear interactions [6]. Several classes of non-linear approaches such as transfer entropy (and related methods) could be useful here as they are model-free, but are limited by the need for large data samples.
1. Hornero, Roberto, et al. “Nonlinear analysis of electroencephalogram and magnetoencephalogram recordings in patients with Alzheimer’s disease.” Philosophical Transactions of the Royal Society A: Mathematical, Physical and Engineering Sciences 367.1887 (2009): 317-336.
2. Gómez, Carlos, et al. “Complexity analysis of resting-state MEG activity in early-stage Parkinson’s disease patients.” Annals of Biomedical Engineering 39.12 (2011): 2935.
3. Andrzejak, Ralph G., et al. “Indications of nonlinear deterministic and finite-dimensional structures in time series of brain electrical activity: Dependence on recording region and brain state.” Physical Review E 64.6 (2001): 061907.
4. Gautama, Temujin, Danilo P. Mandic, and Marc M. Van Hulle. “Indications of nonlinear structures in brain electrical activity.” Physical Review E 67.4 (2003): 046204.
5. Subramaniyam, Narayan Puthanmadam, and Jari Hyttinen. “Characterization of dynamical systems under noise using recurrence networks: Application to simulated and EEG data.” Physics Letters A 378.46 (2014): 3464-3474.
6. Olejarczyk, Elzbieta, et al. “Comparison of connectivity analyses for resting state EEG data.” Journal of neural engineering 14.3 (2017): 036017.