Wavelet transforms can be used to compute coherence in the EEG and estimate dynamic interactions. Here is a primer on how to do this.
Analogous to the standard coherence metrics, wavelet transforms can also be used to compute coherence, known as wavelet coherence [5]. Compared to the standard coherence metric, wavelet coherence can provide time-resolved coupling by using short windows for higher frequencies and longer windows for lower frequencies (Note that one could also use short-time Fourier transform but see this post for a comparison with wavelet transform). This feature is particularly attractive as most of the EEG connectivity estimation techniques do not exploit the superior temporal resolution of EEG and resort to static connectivity measures. Thus, wavelet coherence allows us to obtain a dynamic connectivity measure.
Concept of wavelet coherence
The basic idea behind wavelet coherence is to compute what is known as a cross-wavelet transform [1]. Given two time-series X and Y, the cross-wavelet transform, is defined as
![]()
where WX is the wavelet transform of X and W*Y is the complex-conjugate of the wavelet transform of Y. The cross-wavelet power, which reveals the regions (in time-frequency plane) of common power, is the absolute value of the cross-wavelet transform above. And similar to the definition of coherence, one can define wavelet coherence as,

where s and n denote the wavelet scale (which is related to frequency) and time index respectively. Analogous to the computation of coherence, here < > also denote smoothing, but across both time and scale [1,2]. One can also compute the relative phase between the two time-series by taking the complex argument of the cross-wavelet transform. As we can see, these definitions are very similar to that of Fourier coherence, with the difference that we use wavelet transform instead of Fourier transform, which allows us to identify both frequency bands and time intervals when the two time-series are related.
Application
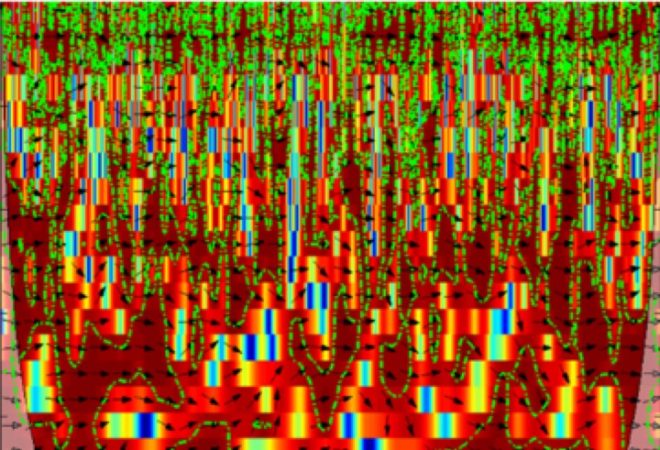
Wavelet coherence has been applied to reveal the dynamics of oscillatory networks in short-term memory retention [3], autism [4] and schizophrenia [5] to mention a few. Computing wavelet coherence requires pre-determined values for the coupling of time and frequency so as to obtain an optimal time-frequency decomposition of the signal. The figure below shows an example of wavelet coherence computed from two EEG time series [6]. The green dashed lines represent the 5% significance regions obtained using surrogate data (Blog link on surrogates). The arrows represent the phase relationship between the signals, with right pointing arrows indicating signals in phase and left pointing arrows indicating anti-phase relation. What is seen at the bottom left and right corners of the figure is the edge effect due to finite data and is typically known as cone effect [6].
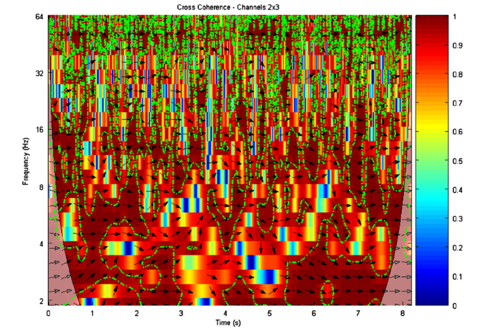
Figure from [6]
Practical considerations
Although wavelet coherence is a really powerful measure to estimate dynamic interaction between two time series, a few things should be kept in mind.
1. When applying it to EEG time series, one has to take into account the effects of volume conduction, which may result in spurious coherence. Using source estimates by solving EEG inverse problem could give more reasonable results, although that has some caveats too (see Source Localization in the EEG and The Inverse Problem in the EEG )
2. Performing significance testing for wavelet coherence is not straightforward. It has been shown for instance that the level of scale smoothing affects the significance levels [1]. As seen below, using different scales per octave impacts the significance levels, where surrogates are created using auto-regressive (AR) model (modeling different noise with AR coefficients shown within square brackets). Thus the choice of scales per octave can impact the results significantly. 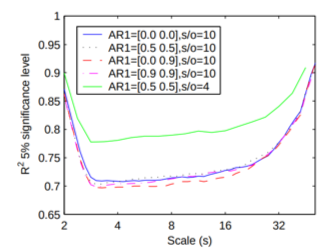
3. Although standard non-parametric surrogate techniques are typically used to perform significance testing, the surrogates generated are stationary, whereas EEG time-series may display irregular fluctuations or time-varying spectra which may cause the null hypothesis to be wrongly rejected. Using non-stationary surrogate algorithms would be a preferred choice [7,8].
A python package to estimate wavelet coherence can be found at – https://pycwt.readthedocs.io/en/latest/
References
[1] Grinsted, Aslak, John C. Moore, and Svetlana Jevrejeva. “Application of the cross wavelet transform and wavelet coherence to geophysical time series.” Nonlinear processes in geophysics 11.5/6 (2004): 561-566..
[2] Torrence, Christopher, and Peter J. Webster. “Interdecadal changes in the ENSO–monsoon system.” Journal of climate12.8 (1999): 2679-2690..
[3] Payne, Lisa, and John Kounios. “Coherent oscillatory networks supporting short-term memory retention.” Brain research 1247 (2009): 126-132.
[4] Catarino, Ana, et al. “Task-related functional connectivity in autism spectrum conditions: an EEG study using wavelet transform coherence.” Molecular autism 4.1 (2013): 1.
[5] Sakkalis, Vangelis, et al. “Time-significant wavelet coherence for the evaluation of schizophrenic brain activity using a graph theory approach.” 2006 International Conference of the IEEE Engineering in Medicine and Biology Society. IEEE, 2006.
[6] Sakkalis, Vangelis. “Review of advanced techniques for the estimation of brain connectivity measured with EEG/MEG.” Computers in biology and medicine 41.12 (2011): 1110-1117.
[7] Chavez, Mario, and Bernard Cazelles. “Detecting dynamic spatial correlation patterns with generalized wavelet coherence and non-stationary surrogate data.” Scientific reports 9.1 (2019): 7389.
[8] Subramaniyam, Narayan Puthanmadam, and Jari Hyttinen. “Dynamics of intracranial electroencephalographic recordings from epilepsy patients using univariate and bivariate recurrence networks.” Physical Review E 91.2 (2015): 022927.