The most popular method of analyzing brain signals is to decompose it into its component sinusoids using the fourier transform. However a non-sinusoidal physiology poses challenges.
The Theory
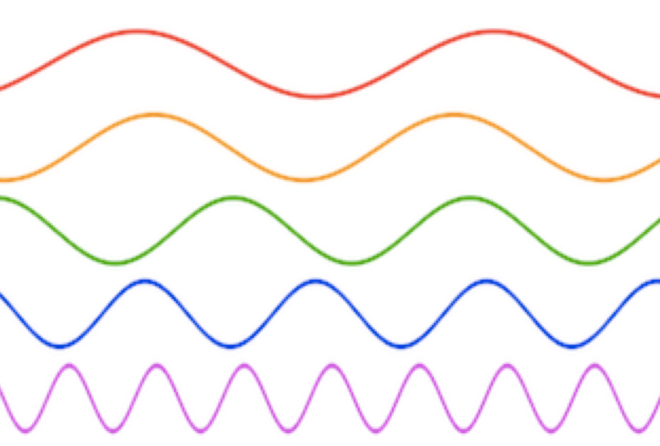
The communication between different groups of neurons needed to coordinate various simulii and translate them into a coherent behavior is thought to be enabled by neuronal oscillations. An oscillation can be defined as cyclical or rhythmic changes in some measure of a signal. When defined in the context of a neural signal like EEG or LFPs, it can be thought of as rhythmic variation in the voltage generated by a pool of neurons that are synchronously firing. An oscillation can be characterized by three properties – 1) frequency (how fast is the rhythm) , 2) amplitude (how strong is the rhythm) and 3) phase (position of the voltage signal in the rhythm). Traditionally, neuronal oscillations are categorized into four frequency bands – alpha (8-13 Hz), beta (13-30 Hz), theta (4-8 Hz), )gamma (30-100 Hz) and delta (0.5-4 Hz) and are given here in the order they were discovered.
See related post The Remarkable Inconsistency of EEG Frequency Bands
It is hypothesized that oscillations are utilized to enable neuronal communication across long distances using cross frequency coupling. The idea here is that the neurons firing at different frequencies interact with each other wherein the phase of the low frequency oscillation modulates the amplitude of the faster one. If this is so, then to characterize this interaction, Fourier analysis is used to filter that data into frequency bands of interest and then the phase and amplitude of the neuronal oscillation is extracted.
Both the underlying assumptions and the choice of analysis are being challenged.
The Fourier Transform
It is well known that one of the basic assumptions when applying Fourier methods is that the oscillatory signal can be be decomposed into a bunch of sinusoidal signals. The basic idea is that any signal can be represented as a weighted sum of sine and cosine waves of different frequencies. We can think of the task of finding these weights or more formally, Fourier coefficients, as solving a linear regression problem, i.e., essentially finding the most optimal weights that best fit a bunch of sine and cosine wave to your signal. Thus, these coefficients or weights simply represent how well sine or cosine wave at a particular frequency fit your signal. If we have a pure sinusoidal signal of 60 Hz, then its Fourier transform will reveal a peak at 60 Hz and nothing more as that is the only frequency contained in the signal and a single sinusoid of 60 Hz will best fit our data! Similarly if our signal can be deconstructed into two sinusoids, then the FT will show peaks at the frequencies of the component sinusoids (see the figure below).
![]() Figure take from : http://mriquestions.com/fourier-transform-ft.html
Figure take from : http://mriquestions.com/fourier-transform-ft.html
The fourier transform today is one of the most popular analytical approaches to brain signals such as EEG and ECOG which reveal a 1/f like structure in the power spectrum.
See related post Factors that Impact Power Spectral Density Estimation
The brain is not a sine wave oscillator
However, it has been shown that brain signals are complex waveforms that are not made up of individual sinusoids. One of the most commonly studied neural oscillation, the hippocampal-theta oscillation looks like a sawtooth wave and so does the respiratory rhythm from olfactory bulb, which has been observed in non-human animals using invasive recordings [1]. In humans, the mu-rhythm, cortical beta oscillations and the slow-wave oscillations recorded during sleep and anesthesia display nonsinusoidal features as well.
 Various nonsinusoidal neuronal oscillations observed in non-human animals and humans. (Figure taken from [1])
For example, the shape of mu-rhythm resembles the greek letter ,mu and hence the name [1]. The cortical beta oscillations have a sawtooth shape and the slow oscillations contain a mixture of shapes involving arches, sawtooth and rectangles [1].
It has been argued that the shape of the waveform is related to the physiology and they are different in different brain regions. Moreover, characteristic shapes are conserved across species. For instance, the sawtooth-like theta hippocampal oscillations has been observed in rabbit, mouse and rat [1].
The EEG itself is a complex waveform with no obvious physiologically underlying sinusoidal elements that have been clearly identified. In the signal itself, the only observed sine wave is typically the alpha oscillation which arises most prominently when a person has their eyes closed and is visible in the autocorrelation.
See related post Alpha Oscillations and Attention
Fourier Transform for nonsinusoidal signals ?
Let us return to Fourier transform. What would happen if we take a nonsinusoidal signal and perform Fourier transformation on it ? It might be helpful to think about an analogy here. It is very easy to measure the perimeter of an idealized geometric shape like a square (shown in grey in the figure below). Think of this square as a sinusoidal signal. You just need one ruler of size X units (think of this ruler as analogous to the sinusoidal basis in Fourier transform) of a particular length and you are done. What about measuring the perimeter of the shape shown in red, in the figure below with a ruler ?
 Figure taken from : https://en.wikipedia.org/wiki/Squircle#/media/File:Superellipse_chamfered_square.svg
One can think of this non-idealized shape (a squircle) as a non-sinusoidal signal. You can of course accurately measure the ‘straight’ parts with a straight ruler of a certain size. But the straight ruler would lead to poor approximation of the rounded parts. Then the solution to measuring the perimeter only using straight rulers (since and cosines) is to use smaller sized rulers. So if we use a ruler of size X/2, we need twice as measurements (i.e., harmonics!). If we further reduce the size of ruler to X/6 or X/10, we would increase our measurements by as many times and these can be thought of as harmonics. Similarly, a non sinusoidal signal like EEG contains multiple frequencies and these end up showing as harmonics when using Fourier transform. The spatiotemporal patterns of neurons themselves can produce aggregate complex patterns, which can nonetheless be decomposed into sinusoids. However, such a decomposition may be purely numerical and not physiological.
It has been shown that these harmonics can be a problem when computing metrics like cross-frequency coupling that look at phase-to-amplitude coupling, since these harmonics are also phase-to-amplitude coupled. Presence of nonsinusoidal oscillations may indicate cross frequency coupling even when none is present. This pitfall or caveat in cross-frequency analysis was reported by Kramer and colleagues [2] , where they showed that if sharp transients are inserted into periodic oscillations , the frequency domain representation of such a signal correspond to high-frequency broadband harmonic components showing spurious, non-zero cross-frequency coupling. Thus, even in the absence of any true interaction, non sinusoidal features of the oscillations can induce correlation between multiple frequency components [2, 3]. An excellent review on the pitfalls of cross-frequency coupling analysis can be found here [4].
Finally, an approach that implicitly assumes an underlying sinusoidal physiology may overlook crucial aspects of the signal structure.
See related post The Blue Frog in the EEG
References
[1] Cole, Scott R., and Bradley Voytek. “Brain oscillations and the importance of waveform shape.” Trends in Cognitive Sciences 21.2 (2017): 137-149.
[2] Kramer, M. A., Tort, A. B. L., and Kopell, N. J. (2008). Sharp edge artifacts and spurious coupling in EEG frequency comodulation measures. J. Neurosci. Methods 170, 352–357. doi: 10.1016/j.jneumeth.2008.01.020
[3] Lozano-Soldevilla, Diego, Niels ter Huurne, and Robert Oostenveld. “Neuronal oscillations with non-sinusoidal morphology produce spurious phase-to-amplitude coupling and directionality.” Frontiers in computational neuroscience 10 (2016): 87.
[4] Aru, J., Aru, J., Priesemann, V., Wibral, M., Lana, L., Pipa, G., et al. (2015). Untangling cross-frequency coupling in neuroscience. Curr. Opin. Neurobiol. 31, 51–61. doi: 10.1016/j.conb.2014.08.002