In the previous blogpost, we discussed how wavelets allow us to perform time-frequency characterization of non-stationary signals such as EEG. Here we discuss some applications of wavelets in analyzing EEG signals in ERPs and epilepsy.
Wavelet entropy in Event-related potential analysis
Event-related potentials (ERPs) are short and non-stationary signals that can benefit from wavelet analysis. Recall that the classical Fourier-based spectral entropy provides a view of how widespread or narrow the power spectrum of a signal is (see [1] and this blog post for more details). However spectral entropy has the limitation that it requires longer duration of data (for stationarity assumption to be fulfilled). Quinroga et al [1] and Rosso et al [2] introduced the application of wavelet entropy towards ERP analysis to unpack the frequency characteristics of various peaks. The idea of wavelet entropy is similar to spectral entropy except that the wavelet coefficients are used to calculate the relative energy in different bands of interest (See [1] for more information). It is commonly assumed that following the presentation of a stimuli, the spontaneous EEG tends to get more synchronized. In terms of entropy this can be interpreted that the signal has more order (narrow power spectrum) and equivalently, the entropy decreases.
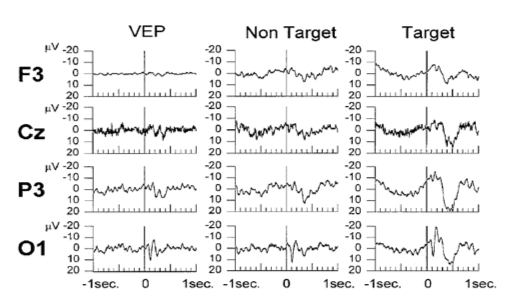
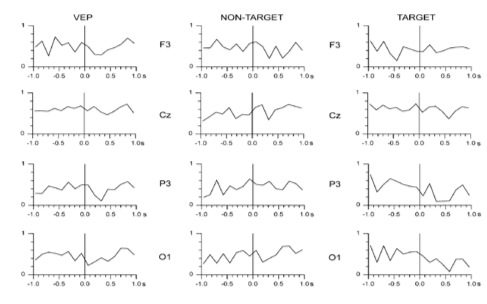 Figure from [1]
In [1], the subjects were shown a checkerboard stimuli (VEP), non-target stimuli (reversed pattern of same checkerboard) and target stimuli (pattern reversal with horizontal and vertical displacement of one-half of the square side length). The corresponding EEG recordings (average over all trials) are shown in the figure below (top). We can observe few things here, 1) Around 100 ms, we see that for all the conditions there is a positive deflection of the ERP (in the occipital electrode site), this is the standard visual response, 2) Only for the target stimuli, we see a large deflection at around 300 ms in all the electrodes.
The result from the wavelet entropy (shown on top) reveals that the entropy decreases at around 300 milliseconds (which corresponds to the P300 ) in relation to the entropy at 100 milliseconds that corresponds the standard visual response. This is in agreement with what is known about the P100-N100 response which are dominated by theta and alpha bands (event-related response). This wide power spectrum (theta+alpha band) results in higher entropy value, whereas the P300 is associated with only delta band and consequently the entropy value is reduced due this relatively narrow band behavior. This further implies that P300 response involves a higher degree of synchronization than that of the ongoing EEG owing to the localized frequency activity in the delta band [1] .
Thus, using wavelet-entropy the information underlying the rich temporal dynamics of ERP can be extracted to study evoked oscillations and the frequency characteristics of various peaks can be analyzed and interpreted in terms of entropy.
Wavelets in Epilepsy
Wavelets have been extensively used in epileptic EEG analysis. Specifically, the interictal EEG, i.e. the EEG recorded between the seizures contains transient spikes. Automatic detection of such spikes are clinically very useful. Although several approaches exist based on the standard definition of spike which is related to its amplitude, sharpness, duration in relation to the baseline activity, they result in a high number of false positives. Latka and Was developed a wavelet-based approach to characterize interictal spikes. In the figure below from [3], the epileptic spike is marked with S and is followed by two motion artifacts. The bottom panel shows the wavelet transform of the signal. It can be noticed that at smaller scales (smaller scales → higher frequencies and vice-versa), the wavelet coefficients have larger values (blue-red => low-high) for the time indices corresponding to the occurrence of the spike whereas for the artifacts, the wavelet coefficients increase monotonically as the scale increases. This contrast in the characteristics of the wavelet coefficients underlying spikes and artifacts can be exploited to build a spike detection system [3].
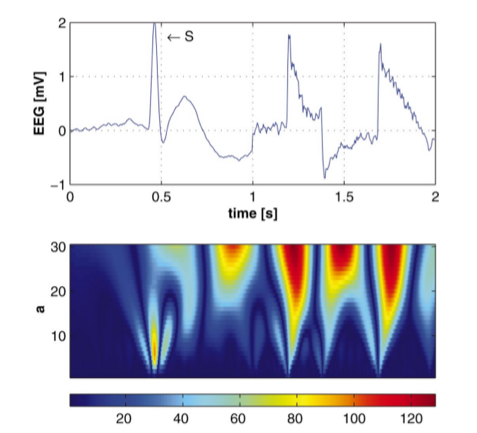 Figure from [2]
In the figure below (left) from [3], the wavelet coefficients are normalized by the variance to minimize the effect of amplitude. Here we see that the epileptic spike has higher values for wavelet coefficients at scale A and B, whereas the artifacts dominate scale C (scales A < B < C). It is also common for a slow-wave complex which has the same amplitude as an epileptic spike, to accompany the spike and the algorithm may falsely detect the slow wave as a spike (figure below, right). In [3], a simple solution to this is proposed in terms of obtaining a linear combination of the wavelet transform that also includes the contribution of the slow wave. It can be seen from the figure below (right), that the normalized wavelet coefficient for the spike again decreases from scale B to scale C, whereas slow wave is dominant at scale C.
In practice, one has to define two thresholds T1 and T2 and the presence of a spike is established if the normalized wavelet coefficient exceeds the threshold at the two scales (A and B) in addition to the wavelet coefficient decreasing from B to C. In [3] the sensitivity and selectivity of the algorithm was tested by varying T1 and T2 and was found to have a sensitivity of 70% whereas a selectivity of 67%.
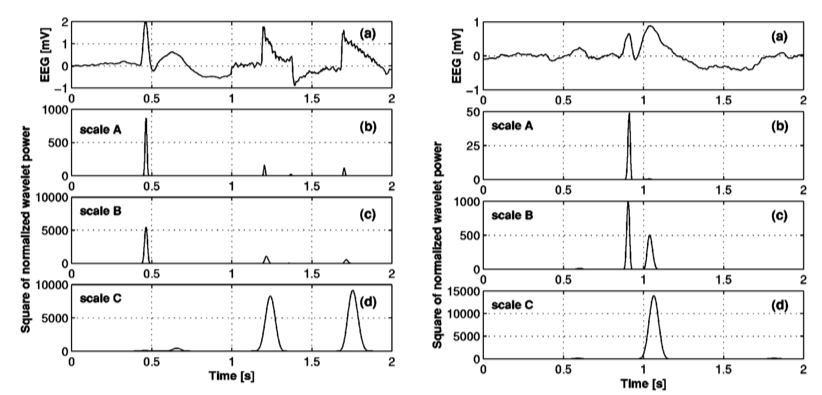 Figure from [2]
Other applications of wavelets in epilepsy have centered around the problem of seizure detection. Adeli et al [4] showed that using wavelet-chaos methodology, they could distinguish between healthy EEG (H), EEG recorded during seizure free interval from epileptic patients (S) and EEG recorded during seizures (S). They decomposed the EEG signals into delta, theta, alpha, beta and gamma bands using wavelets and computed nonlinear measures such as largest Lyapunov exponents and correlation dimension. The results from [4] show nonlinear measures computed on wavelet decomposed EEG allows for a better distinction than measures computed on broadband EEG (0-60 Hz).
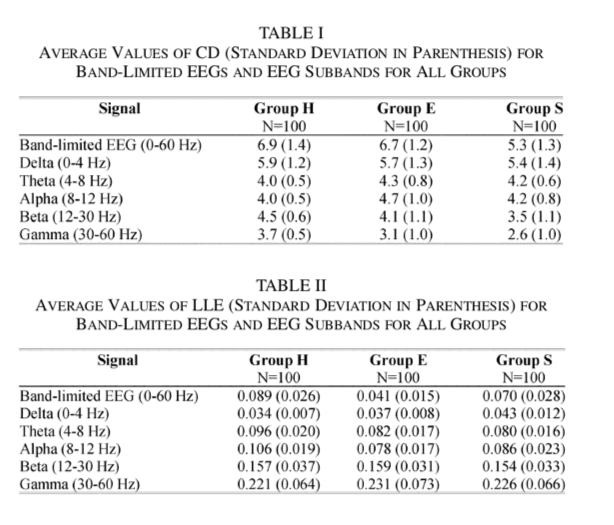 Figure from [4]
References :
[1] Quiroga, R. Quian, et al. “Wavelet entropy in event-related potentials: a new method shows ordering of EEG oscillations.” Biological cybernetics 84.4 (2001): 291-299.
[2] Rosso, Osvaldo A., et al. “Wavelet entropy: a new tool for analysis of short duration brain electrical signals.” Journal of neuroscience methods 105.1 (2001): 65-75.
[3] Latka, Miroslaw, et al. “Wavelet analysis of epileptic spikes.” Physical Review E 67.5 (2003): 052902.
[4]Adeli, Hojjat, Samanwoy Ghosh-Dastidar, and Nahid Dadmehr. “A wavelet-chaos methodology for analysis of EEGs and EEG subbands to detect seizure and epilepsy.” IEEE Transactions on Biomedical Engineering 54.2 (2007): 205-211.