Entropy measures are affected by data length, choice of window length and threshold suggesting caution in how they are used and interpreted.
In previous posts we have discussed different entropy measures and differences in entropy with eyes open and closed. In this post we will demonstrate how different parameters used in computing different entropy measures (Approximate entropy, Sample entropy and Spectral entropy) affect the result. We apply these measures to the same eyes closed and eyes open segments used in the previous post that were downloaded from this website.
Effect of data length
We tested the entropy measures on different data length – 0.75 , 1.5, 3.0, 6.0, 12.0 and 24.0 seconds and computed the mean and standard deviation of 100 EEG data recordings in each condition. The figure below shows the behavior of approximate entropy for the aforementioned data lengths, with the error bar representing the standard error of mean over 100 recordings. It can be seen from the figure that for shorter data lengths, approximate entropy is lower and increases as the data length increases. In fact, this dependence on data length is one of the major limitation of approximate entropy.

In contrast, the sample entropy measure is mostly constant with varying data length as can be seen below. In computation of both these measures we set the window length at m=2 and the threshold of similarity r as 0.2 times the standard deviation of data.

In case of frequency domain measure, we see that spectral entropy is sensitive to data length and increases as the data length increases (see figure below). This is expected as the spectral entropy relies on the discrete Fourier transform, which in turn depends on data length and is less accurate for shorter data. At 0.75 seconds, spectral entropy measure is not able to distinguish the two conditions. Furthermore, the difference between conditions is much smaller than the time domain entropy measures above, something we’ve shown more explicitly in the previous look at entropy in the eyes open, eyes closed conditions.

Effect of parameter choices
In case of approximate and sample entropy, there are two choices that can affect the computation of the entropy measure – 1) m – length of running data and 2) r – which is used in computing the threshold as r*std(data).
In the below figure we can see that increasing ‘m’ decreases approximate entropy and at m=5, the entropy measure for eyes closed and eyes open become indistinguishable.

Sample entropy measure is more robust to the choice of m and the entropy measure is relatively consistent, as it can be seen from the below figure. Also, at higher values of m, using sample entropy we can still distinguish between eyes open and closed condition.

In contrast, the parameter r affects both approximate and sample entropy in a similar manner as shown in the figures below, where we see as the threshold increases, the difference in the entropy measures between both the conditions decreases.

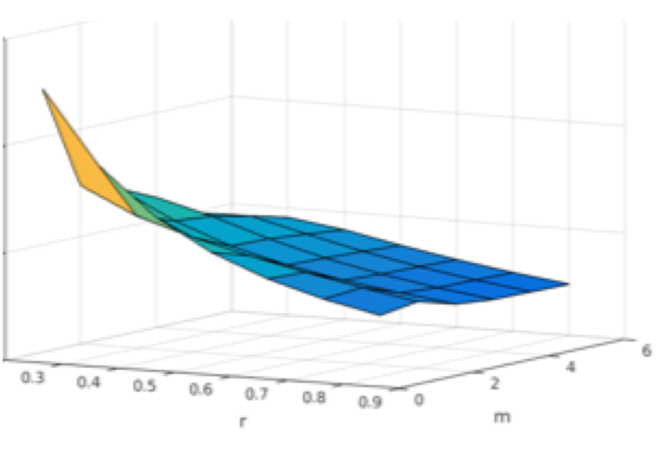
Below we also show the dependence of mean entropy values over 100 recordings in eyes open and closed condition for different values of m (varied from 2 to 6) and r (varied from 0.2 to 0.8). It is evident from the figure that as r increases, entropy values decrease, whereas for a given value of ‘r’, as m is varied entropy values remain more or less constant in case of sample entropy, whereas for approximate entropy at lower values of ‘r’, as ‘m’ is increased the entropy value decreases.

How to choose m and r ?
Although there are no established guidelines in selecting these parameters, the most common choice for m and r are 2 and 0.2 respectively. However, since these values are arbitrary, many studies have criticized this arbitrary choice, particularly for r. In order to avoid significant contribution from noise and as well as admit a reasonable number of m-dimensional data vectors being within a distance r , r should be chosen to be large enough. However, if r is too large then entropy measures will admit too may data vectors and fail to do fine process distinction [1].
It has been suggested that the choice for r should be guided by the signal dynamics [2]. The faster the dynamics, larger should be the value of r. In our example, since we considered signals within 1-40 Hz, choice of 0.2 seemed optimal. For neural signals exhibiting faster dynamics this choice may not be optimal. In case of approximate entropy, another method for choosing r is to vary r between a certain range and choose the value of r for which the approximate entropy is maximum, i.e., choose r such that AppEn(m, N, r) = AppEn_max and this value of r is referred to as r_max. [3]. However, this approach has been found unsuitable for sample entropy, where the optimal choice is given by r at any value of m which maximizes the number of escaping vectors, which can be understood as the number of vectors that escape the neighborhood r when m is increased to m+1 [2].
In summary, for the given dataset we observed that sample entropy has a lower estimation bias and is more robust to the choice of data length and m compared to approximate entropy. But the choice of parameter r affects both sample and approximate entropy significantly and therefore care must be taken in choosing this parameter.
References
- Pincus, Steven M., and Ary L. Goldberger. “Physiological time-series analysis: what does regularity quantify?.” American Journal of Physiology-Heart and Circulatory Physiology266.4 (1994): H1643-H1656.
- Castiglioni, Paolo, et al. “Assessing sample entropy of physiological signals by the norm component matrix algorithm: Application on muscular signals during isometric contraction.” Engineering in Medicine and Biology Society (EMBC), 2013 35th Annual International Conference of the IEEE. IEEE, 2013.
- Restrepo, Juan F., Gastón Schlotthauer, and María E. Torres. “Maximum approximate entropy and r threshold: A new approach for regularity changes detection.” Physica A: Statistical Mechanics and its Applications409 (2014): 97-109.

