There are many tools to assess depression. Here we show that these tools differ in terms of the symptoms they assess and emphasize, resulting in just a an average similarity or assessment consistency of just 42% across all tools.
Depression is a heterogeneous disorder defined by multiple clusters of symptom criteria which differ in their composition. For example, DSM-5 describes nine depression symptom criteria including a depressed mood; diminished interest or pleasure; weight or appetite change; insomnia or hypersomnia; psychomotor agitation or retardation; fatigue or loss of energy; feelings of worthlessness or inappropriate guilt; diminished ability to think or concentrate, or indecisiveness; and recurrent thoughts of death or recurrent suicidal ideation. In order to meet the criteria for depression, you would have to display at least five of these symptoms and this has to include a depressed mood and/or diminished interest or pleasure. However, the way that this plays out means that two people who are both diagnosed with depression might not actually share a single symptom, and evidence suggests that there may be as many as ~1,030 unique symptom profiles present across a population of depressed patients [1]. However, despite this variability, all these patients will end up being given the discrete label of “depression”.
From symptom profiles to assessment measures.
But symptom profiles aren’t the only sources of heterogeneity in relation to depression. As we’ve mentioned in a previous post, the way depression is assessed also varies (See 15 Depression Assessment Tools and Their Differences). By looking at the percentage of questions which asked about a particular symptom for a number of commonly used assessment tools, we showed how depression measures differed in terms of what symptoms they assessed (over a set of 43 possible symptoms), how they emphasized some symptoms over others, and whether they focused predominantly on emotions or physical sensations (or others aspects). Based on this preliminary review we have since gone on to do a more in depth analysis of the similarity, or consistency, between different measures.
Computing consistency scores between assessment tools
The similarity between depression assessment measures was done by computing consistency scores between pairs of tools. In other words, we took the same 15 measures that we reviewed in our previous post and then we directly compared pairs of these measures to determine the symptom consistency between them. By doing this across all pairs, we could then build up a matrix of consistency scores across the whole group of assessment tools.
The consistency scores were calculated based on the percentage of questions assessing each of the 43 symptoms for each assessment tool, on a symptom by symptom basis. The symptoms ranged from everything from Attention & Concentration & Mental Focus through to Fear, Panic & Anxiety through to Restlessness & Impatience. For each pair of assessment tools and each symptom, we calculated the ratio of the two percentages (min/max) as a measure of the % difference between the two questionnaires for that symptom. We then computed a weighted average of these ratios across all symptoms where the symptom was the weighting factor was the average % of questions in both questionnaires. This meant that consistency scores which reflected a greater proportion of questions were weighted more strongly that consistency scores which only reflected a minority of questions.
Highly inconsistent results
The results showed that depression measures were, on average, 42% similar. When looking across individual measures then the consistency scores ranged from a minimum of 19%, through to 86%. The measures which were the most similar were the PHQ9 and CESDR (86%) and the PHQ9 and MADRS (77%). The least similar measures were the QIDS and DASS (19%) and the GDS-LF and QIDS (21%). In other words, the assessment tools showed considerable variation in how similar or dissimilar they were, reflecting the fact that they differ not only in relation to the symptoms that they are assessing but also in terms of the relative importance that they assign to different symptoms. A similar finding of inconsistency across depression measures has also been shown using other analysis approaches [2].
Table of Consistency Scores across Assessment Tools
| BDI-II | CESDR | CESDC | DASS | CDI2 | EPDS | GDS-LF | HAMD | IDS | MADRS | MFQ | PHQ9 | QIDS | RADS2 | ZDS | |
| BDI-II | 40.6 | 42.8 | 31.3 | 52.0 | 36.0 | 32.2 | 36.9 | 45.6 | 39.9 | 52.8 | 46.4 | 32.5 | 49.9 | 59.1 | |
| CESDR | 40.6 | 51.3 | 32.2 | 39.9 | 58.3 | 37.5 | 40.8 | 51.6 | 75.0 | 45.5 | 85.8 | 56.3 | 30.3 | 64.6 | |
| CESDC | 42.8 | 51.3 | 26.6 | 47.6 | 44.8 | 53.8 | 25.4 | 33.3 | 58.8 | 44.6 | 49.2 | 27.4 | 51.6 | 46.7 | |
| DASS | 31.3 | 32.2 | 26.6 | 28.4 | 50.3 | 39.5 | 22.1 | 29.7 | 33.0 | 24.8 | 28.0 | 19.1 | 29.2 | 45.8 | |
| CDI2 | 52.0 | 39.9 | 47.6 | 28.4 | 35.8 | 30.5 | 29.7 | 38.9 | 39.7 | 59.9 | 40.1 | 30.1 | 64.6 | 43.6 | |
| EPDS | 36.0 | 58.3 | 44.8 | 50.3 | 35.8 | 41.4 | 29.6 | 30.7 | 64.2 | 36.3 | 60.0 | 26.3 | 34.4 | 44.4 | |
| GDS-LF | 32.2 | 37.5 | 53.8 | 39.5 | 30.5 | 41.4 | 22.2 | 32.8 | 53.8 | 27.6 | 34.2 | 21.0 | 30.3 | 43.4 | |
| HAMD | 36.9 | 40.8 | 25.4 | 22.1 | 29.7 | 29.6 | 22.2 | 55.5 | 43.9 | 30.5 | 35.4 | 34.7 | 25.2 | 42.9 | |
| IDS | 45.6 | 51.6 | 33.3 | 29.7 | 38.9 | 30.7 | 32.8 | 55.5 | 45.3 | 42.4 | 46.1 | 50.4 | 43.7 | 53.4 | |
| MADRS | 39.9 | 75.0 | 58.8 | 33.0 | 39.7 | 64.2 | 53.8 | 43.9 | 45.3 | 42.0 | 76.7 | 42.0 | 32.4 | 51.7 | |
| MFQ | 52.8 | 45.5 | 44.6 | 24.8 | 59.9 | 36.3 | 27.6 | 30.5 | 42.4 | 42.0 | 48.1 | 34.8 | 54.0 | 39.6 | |
| PHQ9 | 46.4 | 85.8 | 49.2 | 28.0 | 40.1 | 60.0 | 34.2 | 35.4 | 46.1 | 76.7 | 48.1 | 47.4 | 29.9 | 58.8 | |
| QIDS | 32.5 | 56.3 | 27.4 | 19.1 | 30.1 | 26.3 | 21.0 | 34.7 | 50.4 | 42.0 | 34.8 | 47.4 | 24.3 | 40.7 | |
| RADS2 | 49.9 | 30.3 | 51.6 | 29.2 | 64.6 | 34.4 | 30.3 | 25.2 | 43.7 | 32.4 | 54.0 | 29.9 | 24.3 | 38.4 | |
| ZDS | 59.1 | 64.6 | 46.7 | 45.8 | 43.6 | 44.4 | 43.4 | 42.9 | 53.4 | 51.7 | 39.6 | 58.8 | 40.7 | 38.4 |
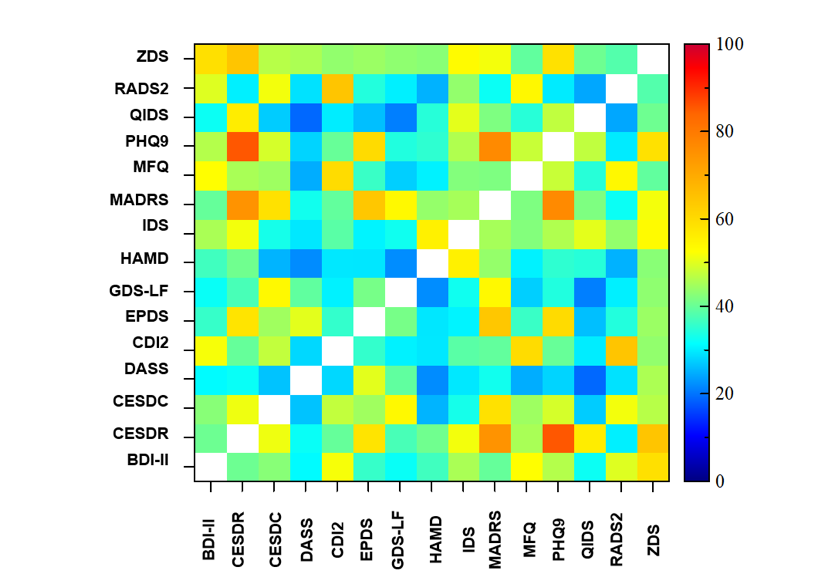 nnColor Matrix of Consistency Scores across Assessment Tools
Making sense of heterogeneity
Disorder heterogeneity and comorbidity are the norm rather than the exception [3]. Understanding and mapping out a patient’s symptom profile is key to being able to provide therapeutic interventions suited to their unique array of symptoms (see The Frustration of Treating Depression). However, the taxonomy of psychiatric diagnosis that results is people displaying different clusters of symptoms being given the same diagnostic label makes this much more difficult (see The Challenges of Mental Health Diagnosis). Furthermore, if the assessment tools which are used to screen for symptoms and severity of depression are themselves inconsistent in the level of importance that they give to different symptoms, then being able to accurately map out this heterogeneity becomes an even greater challenge. This has an impact not only on an individual level when the patient enters the clinic, but also when scaling up to search for disorder or symptom specific biomarkers across larger patient populations.
Instead, the field of mental health, especially with the recent emphasis of transdiagnostic biomarkers [4] and symptom networks [5], could benefit from having a new approach to mental health assessment which isn’t constrained by disorder categories and which covers the breadth of mental health function and dysfunction without bias.
References:
[1] Fried, E., & Nesse, R. (2015). Depression is not a consistent syndrome: An investigation of unique symptom patterns in the STAR*D study. Journal Of Affective Disorders, 172, 96-102. doi: 10.1016/j.jad.2014.10.010
[2] Fried, E. (2017). The 52 symptoms of major depression: Lack of content overlap among seven common depression scales. Journal Of Affective Disorders, 208, 191-197. doi: 10.1016/j.jad.2016.10.019
[3] Plana-Ripoll, O., Pedersen, C., Holtz, Y., Benros, M., Dalsgaard, S., & de Jonge, P. et al. (2019). Exploring Comorbidity Within Mental Disorders Among a Danish National Population. JAMA Psychiatry, 76(3), 259. doi: 10.1001/jamapsychiatry.2018.3658
[4] McTeague, L., Huemer, J., Carreon, D., Jiang, Y., Eickhoff, S., & Etkin, A. (2017). Identification of Common Neural Circuit Disruptions in Cognitive Control Across Psychiatric Disorders. American Journal Of Psychiatry, 174(7), 676-685. doi: 10.1176/appi.ajp.2017.16040400.
[5] Fried, E., van Borkulo, C., Cramer, A., Boschloo, L., Schoevers, R., & Borsboom, D. (2016). Mental disorders as networks of problems: a review of recent insights. Social Psychiatry And Psychiatric Epidemiology, 52(1), 1-10. doi: 10.1007/s00127-016-1319-z


I am glad that someone is doing this important work!
Your results look very interesting. Is this already published/in preparation?
Thank you!!